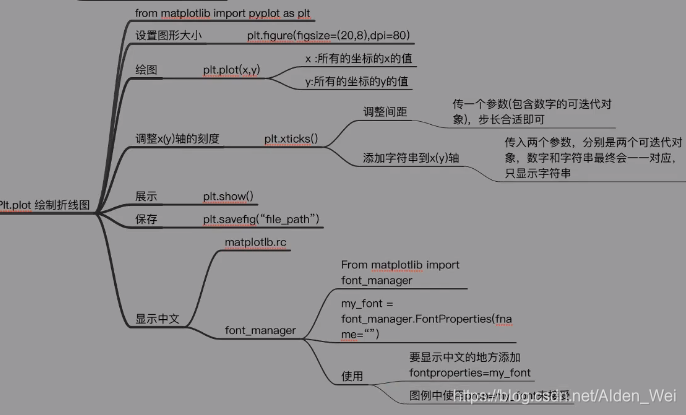
折线图
from matplotlib import pyplot
from matplotlib import font_manager
my_font=font_manager.FontProperties(fname="C:\Windows\Fonts\simhei.ttf")#引用中文字体,该字体为本地字体,word字体一般在此路径
a = range(11, 31)
y = [1, 0, 1, 1, 2, 4, 3, 2, 3, 4, 4, 5, 6, 5, 4, 3, 3, 1, 1, 1, ]
y2 = [ 0, 1, 1, 2, 4, 3, 2, 3, 4, 4, 5, 6, 5, 4, 3, 3, 1, 1, 1, 1]
pyplot.figure(figsize=(15, 15), dpi=100) # 图形设置
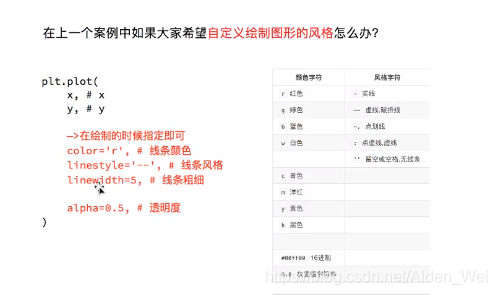
pyplot.plot(a, y,linestyle=":") # 绘制折线图,要想增加图例还需要引用pyplot.legend()函数,linestyle表示虚线实线等风格
pyplot.plot(a, y2,linestyle="--") #绘制第二个折线图,":"表示点虚线
#引用pyplot.legend()函数中的labels来增加图例,只有此处用汉字使用prop,其他都用properties,loc表示位置,具体可参考legend文档
_a = ["{}years".format(i) for i in a] # 用_a代替a,这样可以不仅显示数字,还能显示字符串
pyplot.xticks(a[::5], _a[::5], rotation=45,fontproperties=my_font) # x坐标的刻度,并且用_a代替a,这样可以不仅显示数字,还能显示字符串,fontproperties为引用设置中文,a[::5}表示对x设置5的步长,每隔5显示,取步长只能为list类型的数值
pyplot.yticks(range(min(y), max(y) + 1)) # y坐标的刻度
pyplot.xlabel("年龄",fontproperties=my_font) # x轴标签
pyplot.ylabel("次数",fontproperties=my_font) # y轴标签
pyplot.title("lods×",fontproperties=my_font) # 图形的标题
pyplot.legend(labels=("自己","同桌"),prop=my_font,loc="upper left")
pyplot.grid(alpha=0.4,linestyle=":") #根据x,y轴画网格线,alpha=0.4代表网格线的透明度,可不要,网格线也可以设置虚线
pyplot.show()
pyplot.savefig() #保存,自动保存在当前文档
总结:

其他使用方法请参考matplotlib官方网站,里边含有各种图形绘制方法:
https://matplotlib.org/gallery/index.html
散点图
与折线图唯一区别
pyplot.scatter(a,y3) #绘制散点图
其他方法参考折线图
from matplotlib import pyplot
from matplotlib import  font_manager
import  random
my_font=font_manager.FontProperties(fname="C:\Windows\Fonts\simhei.ttf")

x1=range(1,32)
x2=range(51,82)
y1= [ random.randint(10,25) for i in range(31)]
y2 = [random.randint(0,15) for i in  range(31)]
pyplot.figure(figsize=(15, 15), dpi=100)
pyplot.scatter(x1,y1)
pyplot.scatter(x2,y2)#绘制散点图,由于3月10月分别用不同的坐标轴,因此绘制散点图时分别传入X1,X2

x=list(x1)+list(x2)  #只有list类型的才能相加,因此要先转化为list类型
x_ticks = ["3月{}日".format(i) for i in x1]
x_ticks  += ["5月{}日".format(i-50) for i in x2]
# x坐标的刻度,并且用x_ticks代替x,这样可以不仅显示数字,还能显示字符串,fontproperties为引用设置中文,x[::5}表示对x设置5的步长,每隔5显示,取步长只能为list类型的数值
pyplot.xticks(x[::5], x_ticks[::5], rotation=45,fontproperties=my_font)
pyplot.yticks(range(0,26))

pyplot.xlabel("月份",fontproperties=my_font)
pyplot.ylabel("温度 单位(C)",fontproperties=my_font)
pyplot.title("3月&10月份温度",fontproperties=my_font)

pyplot.legend(labels=("3月份","5月份"),prop=my_font,loc="upper left")
pyplot.grid(alpha=0.4,linestyle="-.")

pyplot.show()
pyplot.savefig()
条形图
唯一区别
pyplot.bar(x,y)
pyplot.barh(range(len(a)),b,height=0.5) #横着的条形图
其他均与折线图,散点图一样
from matplotlib import pyplot
from matplotlib import  font_manager
my_font=font_manager.FontProperties(fname="C:\Windows\Fonts\simhei.ttf")

a = ["战狼2","速度与激情8","功夫瑜伽","西游伏妖篇","变形金刚5:最后的骑士","摔跤吧!爸爸","加勒比海盗5:死无对证",
     "金刚:骷髅岛","极限特工:终极回归","生化危机6:终章","乘风破浪","神偷奶爸3","智取威虎山","大闹天竺","金刚狼3:殊死一战","蜘蛛侠:英雄归来",
     "悟空传","银河护卫队2","情圣","新木乃伊",]
b = [56.01, 26.94, 17.53, 16.49, 15.45, 12.96, 11.8, 11.61, 11.28, 11.12, 10.49, 10.3,8.75, 7.55, 7.32, 6.99, 6.88, 6.86, 6.58, 6.23]
pyplot.figure(figsize=(15, 15), dpi=100)
pyplot.bar(range(len(a)),b,width=0.5) #绘制柱状图,由于画图时不是直接引用fontproperties,因此先用len的数字,然后在替换,width设置柱状图的宽度
# pyplot.barh(range(len(a)),b,height=0.5)
 #绘制横着的柱状图,由于画图时不是直接引用fontproperties,因此先用len的数字,然后在替换,由于横着画图,因此此处使用height而不是width设置柱状图的宽度

pyplot.xticks(range(len(a)), a, rotation=45,fontproperties=my_font)
pyplot.xlabel("电影",fontproperties=my_font)
pyplot.ylabel("票房",fontproperties=my_font)
pyplot.title("不同电影票房",fontproperties=my_font)

pyplot.grid(alpha=0.4,linestyle=":")

pyplot.show()
pyplot.savefig()
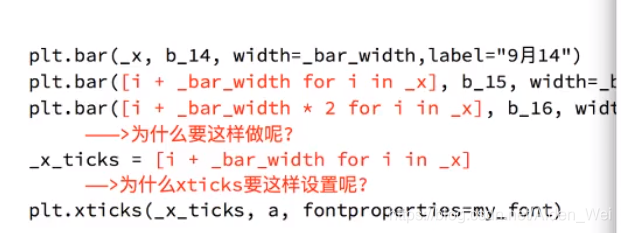
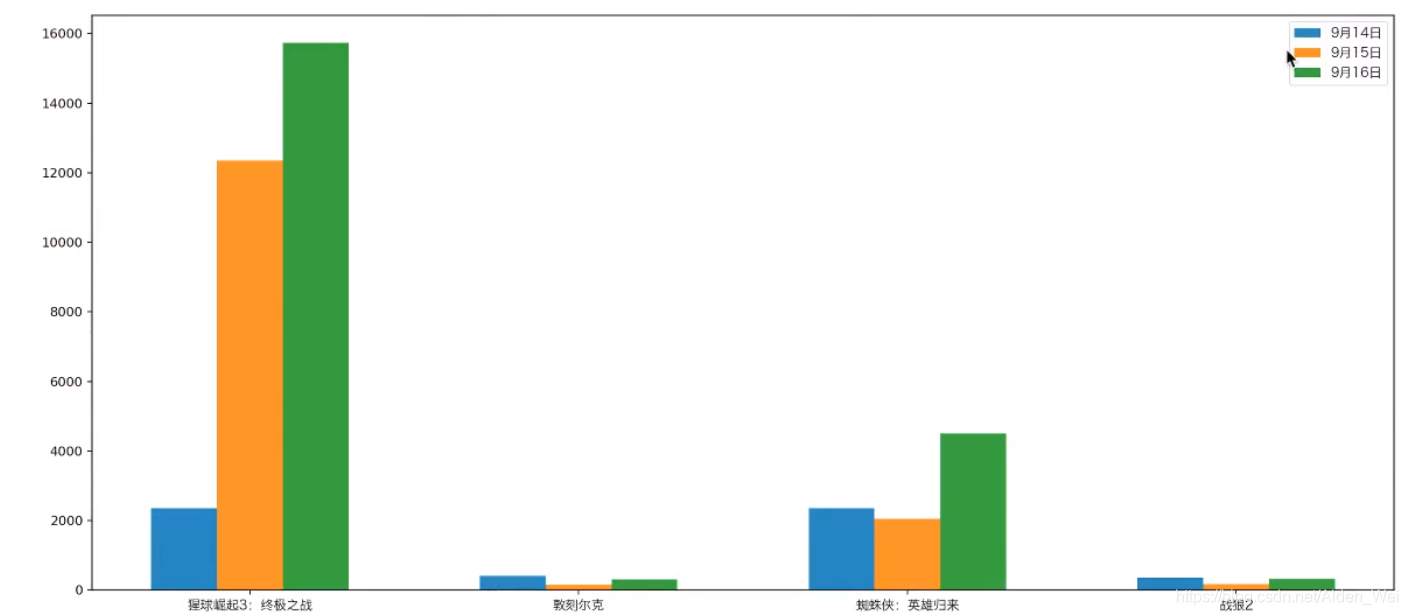
绘制多次条形图
注意:需要将第二次的图形讲X向右移动width距离,即刚好条形图的宽度,以便条形图能刚好链接在一起
直方图(只有没有统计过的数局即原始数据才能绘制直方图,统计过的每类多少人直接用条形图即可)
pyplot.hist(a,num_bins)#num_bins为组数