较完善的城市地下管线体系建成需要十年,学会ThingJS 3D可视化开发只需要一周!
如何使用thingjs迅速生成管线可视化demo,我来为你解答。
在物联网中,对于管线的检测始终存在难度,如何用可视化的方式来解决这个管线监管问题呢?不论是城市管线还是社区,商场、大厦里的管线,想要实时检测到管线的状态都是比较困难的。我们又该如何通过现如今的技术来实现管线的可视化管理呢?
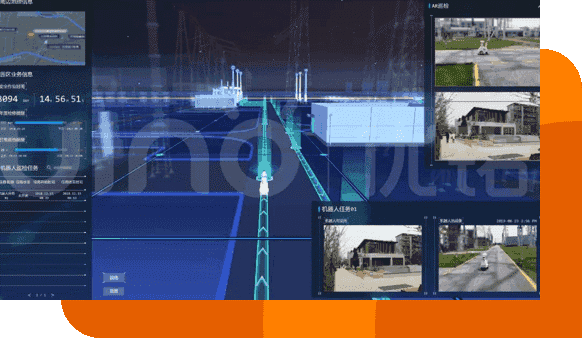
智慧电力可视化系统构建发电、输电、变电、配电、用电、调度、通信信息各个环节逐级可视。具备电站环境可视化、电力设备可视化、电力安防可视化标准功能,同时展示输电网、变电站及其内部的设备位置分布。
ThingJS-面向物联网的3D可视化开发平台
管线.js
/**
* 说明:管线应用
*/
var app = new THING.App({});

// 随机管线连接点
function randomPoints() {
    var points = [[0, 0, 0]];
    var oldType = 2;
    for (var i = 0; i < 50; i++) {
        var old = points[points.length - 1];
        var type = Math.floor(Math.random() * 100) % 3;
        while (oldType == type) {
            type = Math.floor(Math.random() * 100) % 3;
        }
        oldType = type;
        var offset = (Math.random() * 2 + 1) * (Math.random() > 0.5 ? 1 : -1);
        points.push([
            type === 0 ? (old[0] + offset) : old[0],
            type === 1 ? (old[1] + offset) : old[1],
            type === 2 ? (old[2] + offset) : old[2],
        ]);
    }
    return points;
}

// 布置管线
var line = null;
var lineIdx = 1;
function build() {
    // 删除原管线
    if (line) { line.destroy(); }

    // 创建管线
    line = app.create({
        type: 'PolygonLine',
        points: randomPoints(),
        width: 0.2,
        style: {
            image: 'https://thingjs.com/static/images/poly_line_0' + lineIdx + '.png', // 管线中的纹理资源
        }
    });

    // 切换线贴图
    if (lineIdx < 4) { lineIdx++; }
    else { lineIdx = 1; }

    // 开启 UV 动画
    line.scrollUV = true;

    // 设置最适合的摄像机观察位置
    app.camera.fit();
}
build();
new THING.widget.Button('重新布置', build);
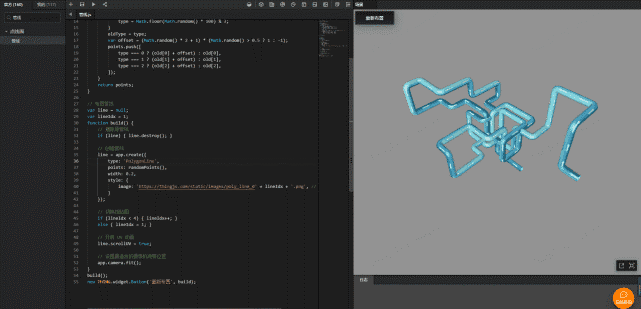
将这个脚本放入到thingjs在线开发平台中,点击运行即可形成如图的管线案例。
不难发现,ThingJS 3D开发的统一语言是JavaScript,不需要额外的3D系统学习,很受欢迎呢!