Preview
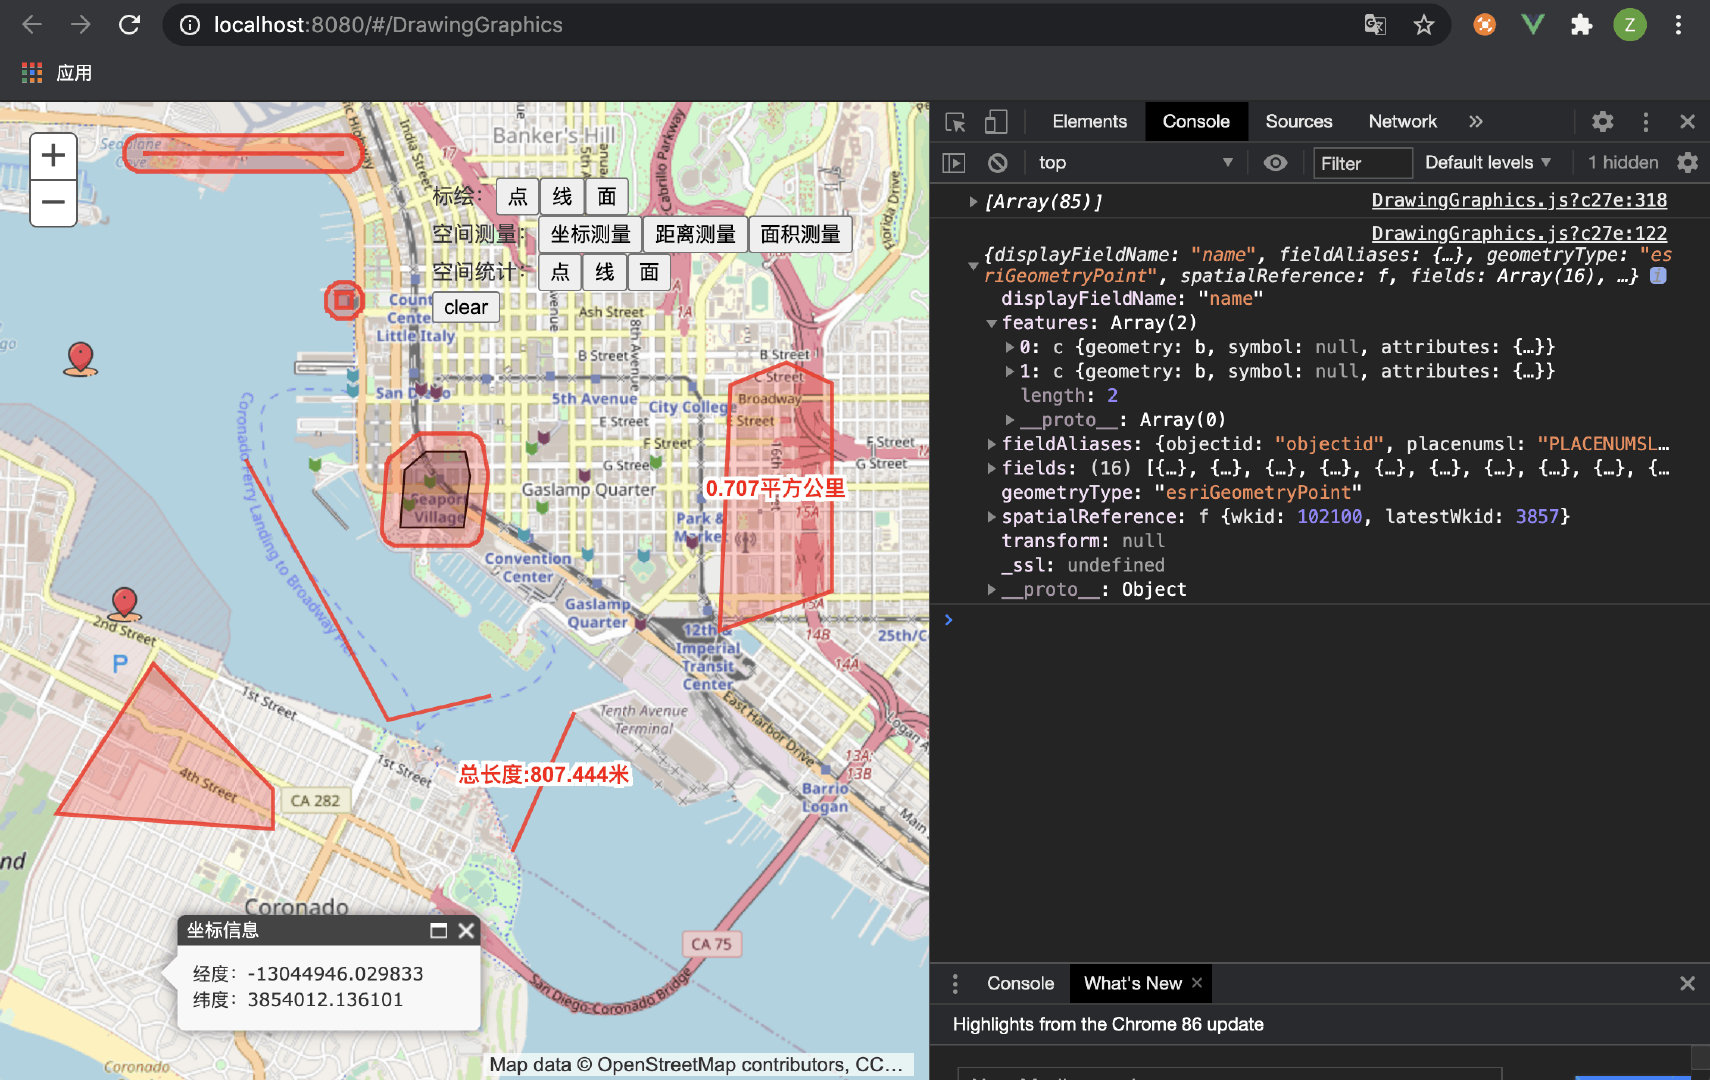
包含绘制的一些基本功能,点线面的绘制,坐标、距离、面积的测量,绘制缓冲区做空间统计功能。点击当前标注可以删除。
功能统一封装
DrawingGraphics.js
import {
    MessageBox
} from 'element-ui' // 做文字标绘

let DrawGraphicsLayer = null // 绘制图形图层
let DrawLayer = null // 绘制图层
let drawingOption = {} // 绘制配置,根据配置可实现空间统计、空间测量、标绘等功能

/**
 * @name: 坐标测量
 * @msg: 显示点击位置的坐标信息
 * @param {event}
 */
function coordinateMeasuring(event) {
    const content = '<div><p>经度:' + event.geometry.x.toFixed(6) + '</p><p>纬度:' + event.geometry.y.toFixed(6) + '</p></div>'
    this.map.infoWindow.resize(200, 100)
    this.map.infoWindow.setTitle('坐标信息')
    this.map.infoWindow.setContent(content)
    this.map.infoWindow.show(event.geometry)
    this.map.infoWindow.on('hide', () => {})
}

/**
 * @name: 设置图片标注
 */
function setPictureMarkerSymbol() {
    return {
        url: require('@/assets/images/ico01.png'),
        height: 20,
        width: 20,
        type: 'esriPMS',
        angle: 0,
    }
}

/**
 * @name: 设置标注颜色
 */
function setSymbolColor(type) {
    if (type === 'fill') {
        // 图形填充颜色
        return new this.gisConstructor.Color([255, 0, 0, 0.25])
    } else if (type === 'line') {
        // 线条颜色
        return new this.gisConstructor.Color([255, 0, 0, 0.8])
    } else {
        return new this.gisConstructor.Color([255, 0, 0, 0.8])
    }
}

/**
 * @name: 设置线标注样式
 */
function setLineSymbolStyle() {
    return {
        color: setSymbolColor.call(this, 'line'),
        width: 2,
    }
}

/**
 * @name: 设置文字标注样式
 * @param {text} String
 */
function setTextSymbolStyle(text) {
    let _this = this
    return {
        text: text,
        color: [255, 0, 0],
        font: new _this.gisConstructor.Font({
            family: 'microsoft Yahei',
            size: 8,
            style: 'normal',
            weight: 'bold',
        }),
        haloColor: [255, 255, 255],
        haloSize: 2, // haloColor 和 haloSize 需要 arcgis 3.15 版本及以上
        horizontalAlignment: 'center', // 文本对齐方式 "left" | "right" | "center" | "justify"
        xoffset: 0,
        yoffset: 0,
    }
}

/**
 * @name: 根据 id 清除图形
 * @msg: 点击当前标注可以删除
 * @param {ID}
 */
function clearCurrentMarker(ID) {
    const graphicsArr = DrawGraphicsLayer.graphics
    for (let i = graphicsArr.length - 1; i >= 0; i--) {
        if (
            graphicsArr[i].attributes.id && graphicsArr[i].attributes.id === ID
        ) {
            DrawGraphicsLayer.remove(graphicsArr[i])
        }
    }
}

/**
 * @name: 地图点击
 * @param {event}
 */
function mapHandleClick(event) {
    if (event.graphic && event.graphic.attributes) {
        let attributes = event.graphic.attributes
        clearCurrentMarker(attributes.id)
    }
}

/**
 * @name: 查询缓冲区范围内的数据
 * @param {geometry} 几何图形
 */
function doQueryBuffer(geometry) {
    let queryUrl = drawingOption.StatisticalServerURL || ''
    let query = new this.gisConstructor.query()
    query.geometry = geometry
    query.outFields = ['*']
    query.returnGeometry = true
    var queryTask = new this.gisConstructor.QueryTask(queryUrl)
    queryTask.execute(
        query,
        (featureSet) => {
            console.log(featureSet)
        },
        (error) => {
            console.log(error)
        }
    )
}

/**
 * @name: 绘制图形
 * @param {event}
 */
function drawGraphic(event) {
    let _this = this
    let symbol = ''
    let _type = event.geometry.type
    let resultSymbol = '' // 绘制的完整图形
    let symbolID = 'symbolMarker' + new Date().getTime() // 用于删除当前标注

    if (drawingOption.name === '标绘') {
        if (_type === 'point' && drawingOption.text === false) {
            resultSymbol = new this.gisConstructor.PictureMarkerSymbol(setPictureMarkerSymbol.call(this))
            DrawGraphicsLayer.add(new this.gisConstructor.graphic(
                event.geometry,
                resultSymbol, {
                    id: symbolID,
                    name: '图形标注'
                }
            ))
        } else if (_type === 'point' && drawingOption.text === true) {
            // 文字标绘
            MessageBox.prompt('', '请输入文字', {
                confirmButtonText: '确定',
                cancelButtonText: '取消'
            }).then(
                ({
                    value
                }) => {
                    if (value !== '') {
                        resultSymbol = new this.gisConstructor.TextSymbol(setTextSymbolStyle.call(this, value))
                        DrawGraphicsLayer.add(new this.gisConstructor.graphic(
                            event.geometry,
                            resultSymbol, {
                                id: symbolID,
                                name: '图形标注'
                            }
                        ))
                    }
                }
            ).catch(error => {
                console.log(error)
            })
        } else if (_type === 'polyline') {
            resultSymbol = new this.gisConstructor.SimpleLineSymbol(setLineSymbolStyle.call(this))
            console.log(event.geometry)
            console.log(new this.gisConstructor.graphic(
                event.geometry,
                resultSymbol, {
                    id: symbolID,
                    name: '图形标注'
                }
            ))
            DrawGraphicsLayer.add(new this.gisConstructor.graphic(
                event.geometry,
                resultSymbol, {
                    id: symbolID,
                    name: '图形标注'
                }
            ))
        } else if (_type === 'polygon') {
            // 添加绘制好的面图形
            resultSymbol = new this.gisConstructor.SimpleFillSymbol(
                this.gisConstructor.SimpleFillSymbol.STYLE_SOLID,
                new this.gisConstructor.SimpleLineSymbol(setLineSymbolStyle.call(this)),
                setSymbolColor.call(this, 'fill'),
            )
            DrawGraphicsLayer.add(new this.gisConstructor.graphic(
                event.geometry,
                resultSymbol, {
                    id: symbolID, // 删除功能
                    name: '图形标注'
                }
            ))
        }
    }
    if (drawingOption.name === '空间测量') {
        if (_type === 'point') {
            // infoWindow 显示坐标信息
            coordinateMeasuring.call(this, event)
        } else if (_type === 'polyline') {
            resultSymbol = new this.gisConstructor.SimpleLineSymbol(setLineSymbolStyle.call(this))
            DrawGraphicsLayer.add(new this.gisConstructor.graphic(
                event.geometry,
                resultSymbol, {
                    id: symbolID,
                    name: '图形标注'
                }
            ))

            // 测量距离
            const lengthParams = new _this.gisConstructor.LengthsParameters()
            const geometryService = new _this.gisConstructor.GeometryService(
                drawingOption.GeometryServerURL
            )
            lengthParams.distanceUnit = _this.gisConstructor.GeometryService.UNIT_KILOMETER
            lengthParams.calculationType = 'preserveShape'
            const polyline = new _this.gisConstructor.Polyline(
                _this.map.spatialReference
            )
            const paths = event.geometry.paths[0]
            polyline.addPath(paths)
            lengthParams.polylines = [polyline]
            // 根据参数,动态计算长度
            geometryService.lengths(lengthParams, (length) => {
                let distance = _this.gisConstructor.number.format(length.lengths[0])
                // 设距离显示样式,并添加到地图上
                let text = '总长度:' + distance + '米'
                const distanceSymbol = new _this.gisConstructor.TextSymbol(setTextSymbolStyle.call(this, text))
                const distanceCenterPoint = event.geometry.getExtent().getCenter()
                const distancePoint = new _this.gisConstructor.Point(distanceCenterPoint, _this.map.spatialReference)
                const distanceGraphic = new _this.gisConstructor.graphic(
                    distancePoint,
                    distanceSymbol, {
                        id: symbolID, // 删除功能
                        name: '图形标注'
                    }
                )
                DrawGraphicsLayer.add(distanceGraphic)
            })
        } else if (_type === 'polygon') {
            // 添加绘制好的面图形
            resultSymbol = new this.gisConstructor.SimpleFillSymbol(
                this.gisConstructor.SimpleFillSymbol.STYLE_SOLID,
                new this.gisConstructor.SimpleLineSymbol(setLineSymbolStyle.call(this)),
                setSymbolColor.call(this, 'fill'),
            )
            DrawGraphicsLayer.add(new this.gisConstructor.graphic(
                event.geometry,
                resultSymbol, {
                    id: symbolID, // 删除功能
                    name: '图形标注'
                }
            ))

            // 测量面积
            // https://developers.arcgis.com/javascript/3/jsapi/geometryservice-amd.html
            const areasAndLengthParams = new this.gisConstructor.AreasAndLengthsParameters()
            const geometryService = new this.gisConstructor.GeometryService(drawingOption.GeometryServerURL)
            areasAndLengthParams.areaUnit = this.gisConstructor.GeometryService.UNIT_SQUARE_KILOMETERS // 平方公里(平方米:UNIT_SQUARE_METERS)
            areasAndLengthParams.calculationType = 'preserveShape'
            geometryService.simplify([event.geometry], (simplifiedGeometries) => {
                areasAndLengthParams.polygons = simplifiedGeometries
                geometryService.areasAndLengths(areasAndLengthParams, (area) => {
                    let areas = this.gisConstructor.number.format(area.areas[0])
                    // 设距离显示样式,并添加到地图上
                    let text = areas + '平方公里'
                    const areaSymbol = new this.gisConstructor.TextSymbol(setTextSymbolStyle.call(this, text))
                    const areaCenterPoint = event.geometry.getExtent().getCenter()
                    const areaPoint = new this.gisConstructor.Point(areaCenterPoint, this.map.spatialReference)
                    const areaGraphic = new this.gisConstructor.graphic(
                        areaPoint,
                        areaSymbol, {
                            id: symbolID, // 删除功能
                            name: '图形标注'
                        }
                    )
                    DrawGraphicsLayer.add(areaGraphic)
                })
            })
        }
    }
    if (drawingOption.name === '空间统计') {
        if (_type === 'point') {
            symbol = new this.gisConstructor.SimpleMarkerSymbol(
                this.gisConstructor.SimpleMarkerSymbol.STYLE_SQUARE,
                10,
                new this.gisConstructor.SimpleLineSymbol(setLineSymbolStyle.call(this)),
                setSymbolColor.call(this, 'fill')
            )
        } else if (_type === 'polyline') {
            symbol = new _this.gisConstructor.SimpleLineSymbol(setLineSymbolStyle.call(this))
        } else if (_type === 'polygon') {
            symbol = new this.gisConstructor.SimpleFillSymbol(
                this.gisConstructor.SimpleFillSymbol.STYLE_NONE,
                new this.gisConstructor.SimpleLineSymbol(
                    this.gisConstructor.SimpleLineSymbol.STYLE_DASHDOT,
                    new this.gisConstructor.SimpleLineSymbol(setLineSymbolStyle.call(this)),
                    setSymbolColor.call(this, 'fill'),
                ),
                new this.gisConstructor.Color(setSymbolColor.call(this, 'fill'))
            )
        }

        let drawingGraphic = new this.gisConstructor.graphic(event.geometry, symbol, {
            id: symbolID,
            name: '图形标注'
        })
        DrawGraphicsLayer.add(drawingGraphic)
        // 空间统计做缓冲区,查询数据
        let params = new this.gisConstructor.BufferParameters()
        params.bufferSpatialReference = this.map.spatialReference
        params.outSpatialReference = this.map.spatialReference
        params.distances = [Number(drawingOption.distances) || 1]
        params.unit = this.gisConstructor.GeometryService.UNIT_METER
        params.geodesic = true
        params.geometries = [drawingGraphic.geometry]

        new this.gisConstructor.GeometryService(drawingOption.GeometryServerURL || 'https://sampleserver6.arcgisonline.com/arcgis/rest/services/Utilities/Geometry/GeometryServer').buffer(params, features => {
            let symbol = new _this.gisConstructor.SimpleFillSymbol(
                _this.gisConstructor.SimpleFillSymbol.STYLE_SOLID,
                new _this.gisConstructor.SimpleLineSymbol(
                    setLineSymbolStyle.call(this)
                ),
                new _this.gisConstructor.Color(setSymbolColor.call(this, 'fill'))
            )
            let graphic = new _this.gisConstructor.graphic(features[0], symbol, {
                id: symbolID,
                name: '图形标注'
            })
            DrawGraphicsLayer.add(graphic)

            // 获取缓冲范围里的数据一般有两种情况:
            // 一:用 MapServer 查询
            doQueryBuffer.call(_this, graphic.geometry)

            // 二:取构成图形范围的坐标点集合传给后台,后台查询图形范围内的数据,例如:
            let rings = features[0].rings
            console.log(rings)
        })
    }
    DrawLayer.deactivate()
    this.map.setMapCursor('default')
}

/**
 * @name: 初始化绘制图层
 */
function initDrawLayer() {
    // GraphicsLayer 第一个参数是 url,没有也要占位,否则在第二个参数对象中设置图层 id 等信息无效,无法通过 map.addLayer(id) 获取指定 id 的图层
    DrawGraphicsLayer = new this.gisConstructor.GraphicsLayer('', {
        id: '绘制图层'
    }, this.map.spatialReference)
    this.map.addLayer(DrawGraphicsLayer)
    DrawLayer = new this.gisConstructor.draw(this.map, {
        showTooltips: true
    })
    // 官网:draw-end This event is deprecated. Use draw-complete instead.
    DrawLayer.on('draw-complete', drawGraphic.bind(this))
}

/**
 * @name: 绘制工具
 * @param {status} 绘制状态
 * @return {option} 配置
 */
function DrawingGraphics(status, option) {
    drawingOption = option
    if (!DrawLayer) {
        // 防止第二次点击绘制类型,任然为上一次绘制类型状态
        initDrawLayer.call(this)
    }
    if (status === 'active') {
        DrawLayer.activate(option.type)
        this.map.setMapCursor('crosshair')
    } else {
        // 清除绘制状态和绘制图形
        DrawLayer.deactivate()
        this.map.setMapCursor('default')
        DrawGraphicsLayer.clear()
        this.map.infoWindow.hide()
    }
    this.map.on('click', mapHandleClick.bind(this))
}

export {
    DrawingGraphics
}
使用
<template>
  <div id="map-container"
       style="width:100%;height:100%;">
    <div
         style="position:absolute;right:50px;top:50px;z-index:999;">
      <span>标绘:</span>
      <button
              @click="drawingGraphicsTool('标绘', 'point')">点</button>
      <button
              @click="drawingGraphicsTool('标绘', 'polyline')">线</button>
      <button
              @click="drawingGraphicsTool('标绘', 'polygon')">面</button>
      <button
              @click="drawingGraphicsTool('标绘', 'point', 'text')">文字</button>
      <br>
      <span>空间测量:</span>
      <button
              @click="drawingGraphicsTool('空间测量', 'point')">坐标测量</button>
      <button
              @click="drawingGraphicsTool('空间测量', 'polyline')">距离测量</button>
      <button
              @click="drawingGraphicsTool('空间测量', 'polygon')">面积测量</button>
      <br>
      <span>空间统计:</span>
      <button
              @click="drawingGraphicsTool('空间统计', 'point')">点</button>
      <button
              @click="drawingGraphicsTool('空间统计', 'polyline')">线</button>
      <button
              @click="drawingGraphicsTool('空间统计', 'polygon')">面</button>
      <br>
      <button
              @click="drawingGraphicsTool()">clear</button>
    </div>
  </div>
</template>
<script>
import { loadCss, loadModules } from 'esri-loader'
import { DrawingGraphics } from './DrawingGraphics.js'
export default {
  name: 'DrawingGraphics',
  components: {},
  data() {
    return {
      map: '',
      gisConstructor: {}, // gis 构造函数
      gisModules: [
        'esri/map',
        'esri/SpatialReference',
        'esri/geometry/Extent',
        'esri/geometry/Point',
        'esri/geometry/Polyline',
        'esri/geometry/Polygon',
        'esri/geometry/geometryEngine',
        'esri/tasks/GeometryService',
        'esri/tasks/ProjectParameters',
        'esri/tasks/AreasAndLengthsParameters',
        'esri/tasks/LengthsParameters',
        'esri/tasks/query',
        'esri/tasks/QueryTask',
        'esri/tasks/BufferParameters',
        'esri/graphic',
        'esri/symbols/PictureMarkerSymbol',
        'esri/symbols/TextSymbol',
        'esri/symbols/SimpleMarkerSymbol',
        'esri/symbols/SimpleLineSymbol',
        'esri/symbols/SimpleFillSymbol',
        'esri/symbols/Font',
        'esri/layers/GraphicsLayer',
        'esri/layers/ArcGISDynamicMapServiceLayer',
        'esri/layers/ArcGISTiledMapServiceLayer',
        'esri/toolbars/draw',
        'esri/Color',
        'dojo/_base/declare',
        'dojo/number',
        'esri/config',
        'esri/geometry/normalizeUtils',
      ],
    }
  },
  mounted() {
    this.init()
  },
  methods: {
    /**
     * @name: 地图点击事件
     */
    mapClickFun() {
      this.map.on('click', () => { })
    },

    /**
     * @name: 绘制工具
     * @msg: 标绘,空间测量,空间统计
     * @param {name}
     * @param {type}
     * @param {text} true
     */
    drawingGraphicsTool(name, type, text) {
      if (name && type) {
        let option = {}
        if (name === '标绘') {
          option = {
            name: '标绘',
            type: type,
            text: text ? true : false,
          }
        }
        if (name === '空间测量') {
          option = {
            GeometryServerURL:
              'https://sampleserver6.arcgisonline.com/arcgis/rest/services/Utilities/Geometry/GeometryServer',
            name: '空间测量',
            type: type,
          }
        }
        if (name === '空间统计') {
          option = {
            StatisticalServerURL:
              'https://sampleserver6.arcgisonline.com/arcgis/rest/services/StoryMaps/StoryMapPlaces4/MapServer/0',
            GeometryServerURL:
              'https://sampleserver6.arcgisonline.com/arcgis/rest/services/Utilities/Geometry/GeometryServer',
            distances: 100,
            name: '空间统计',
            type: type,
          }
        }
        DrawingGraphics.call(this, 'active', option)
      } else {
        DrawingGraphics.call(this, 'clear')
      }
    },

    /**
     * @name: 初始化地图
     */
    init() {
      // 加载 css
      loadCss('https://js.arcgis.com/3.32/esri/css/esri.css')
      // 加载模块
      loadModules(this.gisModules, {
        url: 'https://js.arcgis.com/3.32/init.js',
      })
        .then(this.initMap)
        .then(this.mapClickFun)
    },
    // 初始化地图
    initMap(args) {
      // 将 ArcGIS 的每个功能模块都存放到 gisConstructor 中
      for (let k in args) {
        let name = this.gisModules[k].split('/').pop()
        this.gisConstructor[name] = args[k]
      }
      this.map = new this.gisConstructor.map('map-container', {
        basemap: 'osm',
        logo: false,
        slider: true,
      })
      let extent = {
        xmin: -117.1839455,
        ymin: 32.68087830000002,
        xmax: -117.15035189999998,
        ymax: 32.732100979999984,
      }
      /*
        如果坐标系是 4490,初始化范围需要设置空间参考坐标系
        new this.gisConstructor.SpatialReference({
          wkid: 4490
        })
      */
      this.map.setExtent(
        new this.gisConstructor.Extent(
          extent.xmin,
          extent.ymin,
          extent.xmax,
          extent.ymax,
          new this.gisConstructor.SpatialReference()
        )
      )
      // 添加一个 MapServer 做测试
      let StoryMapPlaces4 = new this.gisConstructor.ArcGISDynamicMapServiceLayer(
        'https://sampleserver6.arcgisonline.com/arcgis/rest/services/StoryMaps/StoryMapPlaces4/MapServer',
        {
          id: 'StoryMapPlaces4',
          opacity: 1,
          visible: true,
        }
      )
      this.map.addLayer(StoryMapPlaces4, 2)
    },
  },
}
</script>