淘宝深入千家万户,每个淘宝用户每天都会情不自禁的点开手机app或者网站,去看看自己喜欢的产品,或者被app推荐的产品深深吸引不能自拔。我们每天都面临着是否要剁手的灵魂拷问。本文将教你如何使用时序数据库对淘宝的用户行为进行分析。我们以DolphinDB database 为例,DolphinDB是新一代的高性能分布式时序数据库(time-series database),同时具有丰富的数据分析和分布式计算功能。本教程使用DolphinDB对淘宝APP的用户行为数据进行分析,进一步分析业务问题。
数据来源:User Behavior Data from Taobao for Recommendation-数据集-阿里云天池
本教程中,我们把DolphinDB以及使用的数据集封装到docker中。docker中包含了DolphinDB的分布式数据库dfs://user_behavior 。它包含一张表user,保存了2017年11月25日到2017年12月3日之间将近一百万淘宝APP用户的行为记录。我们采用组合分区方式,第一层按照日期分区,每天一个分区,第二层按照userID进行哈希分区,一共划分为180个分区。user表的结构如下所示:
各种用户行为类型的含义如下:
- pv:浏览商品详情页
- buy:商品购买
- cart:将商品加入购物车
- fav:收藏商品
1. 下载docker部署包
本教程已经把DolphinDB以及用到的数据封装到docker容器中。使用前确保docker环境已经部署好。docker安装教程请参考https://docs.docker.com/install/。从http://www.dolphindb.cn/downloads/bigdata.tar.gz下载部署包,到部署包所在目录执行以下代码。
解压部署包:
gunzip bigdata.tar.gz导入容器快照作为镜像:
cat bigdata.tar | docker import - my/bigdata:v1获取镜像my/bigdata:v1的ID:
docker images启动容器(根据实际情况替换images id):
docker run -dt -p 8888:8848 --name test <image id> /bin/bash ./dolphindb/start.sh在浏览器地址栏中输入本机IP地址:8888,如localhost:8888,进入DolphinDB Notebook。以下代码均在DolphinDB Notebook中执行。
该docker中的DolphinDB license有效期到2019年9月1日,如果license文件过期,只需要到DolphinDB官网下载社区版,用社区版的license替换bigdata.tar/dolphindb/dolphindb.lic即可。
2. 用户行为分析
查看数据量:
login("admin","123456")
user=loadTable("dfs://user_behavior","user")
select count(*) from user
98914533
user表中一共有98,914,533条记录。
分析用户从浏览到最终购买商品整个过程的行为情况:
PV=exec count(*) from user where behavior="pv"88596903
UV=count(exec distinct userID from user)987984
在这9天中,淘宝APP的页面访问量为88,596,903,独立访客为987,984。
上面使用到的exec是DolphinDB独有的功能,它与select类似。两者的区别是,select语句总是返回一个表,exec选择一列时会返回一个向量,与聚合函数一起使用时会返回一个标量,与pivoy by一起使用时会返回一个矩阵,方便后续对数据的计算。
统计只浏览一次页面的用户数量:
onceUserNum=count(select count(behavior) from user group by userID having count(behavior)=1)92
jumpRate=onceUserNum\UV*1000.009312
只有92个用户只浏览过一个页面就离开了APP,占总用户数的0.0093%,几乎可以忽略不计,说明淘宝有足够的吸引力让用户停留在APP中。
统计各个用户行为的数量:
behaviors=select count(*) as num from user group by behavior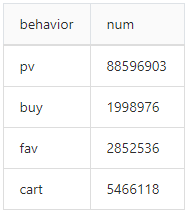
计算从有浏览到有意向购买的转化率:
将商品加入购物车和收藏商品都可以认为用户有意向购买。统计有意向购买的用户行为数量:
fav_cart=exec sum(num) from behaviors where behavior="fav" or behavior="cart"8318654
intentRate=fav_cart\PV*1009.389328
从浏览到有意向购买只有9.38%的转化率。
buy=(exec num from behaviors where behavior="buy")[0]1998976
buyRate=buy\PV*1002.256259
intent_buy=buy\fav_cart*10024.030041
从浏览到最终购买只有2.25%的转化率,从有意向购买到最终购买的转化率为24.03%,说明大部分用户用户会把中意的商品收藏或加入购物车,但不一定会立即购买。
对各种用户行为的独立访客进行统计:
userNums=select count(userID) as num from (select count(*) from user group by behavior,userID) group by behavior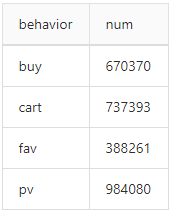
pay_user_rate=(exec num from userNums where behavior="buy")[0]\UV*10067.852313
这9天中,使用淘宝APP的付费用户占67.8%,说明大部分用户会在淘宝APP上购物。
统计每天各种用户行为的用户数量:
dailyUserNums=select sum(iif(behavior=="pv",1,0)) as pageView, sum(iif(behavior=="fav",1,0)) as favorite, sum(iif(behavior=="cart",1,0)) as shoppingCart, sum(iif(behavior=="buy",1,0)) as payment from user group by date(behaveTime) as date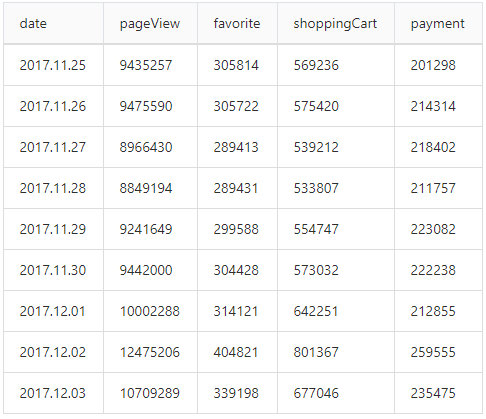
周五、周六和周日(2017.11.25、2017.11.26、2017.12.02、2017.12.03)淘宝APP的访问量明显增加。
iif是DolphinDB的条件运算符,它的语法是iif(cond, trueResult, falseResult),cond通常是布尔表达式,如果满足cond,则返回trueResult,如果不满足cond,则返回falseResult。
分别统计每天不同时间段下各种用户行为的数量。我们提供了以下两种方法:
第一种方法是分别统计各个时间段的数据,再把各个结果合并。例如,统计工作日2017.11.29(周三)不同时间段的用户行为数量。
re1=select first(behaveTime) as time, sum(iif(behavior=="pv",1,0)) as pageView, sum(iif(behavior=="fav",1,0)) as favorite, sum(iif(behavior=="cart",1,0)) as shoppingCart, sum(iif(behavior=="buy",1,0)) as payment from user where behaveTime between 2017.11.29T00:00:00 : 2017.11.29T05:59:59

re2=select first(behaveTime) as time, sum(iif(behavior=="pv",1,0)) as pageView, sum(iif(behavior=="fav",1,0)) as favorite, sum(iif(behavior=="cart",1,0)) as shoppingCart, sum(iif(behavior=="buy",1,0)) as payment from user where behaveTime between 2017.11.29T06:00:00 : 2017.11.29T08:59:59

re3=select first(behaveTime) as time, sum(iif(behavior=="pv",1,0)) as pageView, sum(iif(behavior=="fav",1,0)) as favorite, sum(iif(behavior=="cart",1,0)) as shoppingCart, sum(iif(behavior=="buy",1,0)) as payment from user where behaveTime between 2017.11.29T09:00:00 : 2017.11.29T11:59:59

re4=select first(behaveTime) as time, sum(iif(behavior=="pv",1,0)) as pageView, sum(iif(behavior=="fav",1,0)) as favorite, sum(iif(behavior=="cart",1,0)) as shoppingCart, sum(iif(behavior=="buy",1,0)) as payment from user where behaveTime between 2017.11.29T12:00:00 : 2017.11.29T13:59:59

re5=select first(behaveTime) as time, sum(iif(behavior=="pv",1,0)) as pageView, sum(iif(behavior=="fav",1,0)) as favorite, sum(iif(behavior=="cart",1,0)) as shoppingCart, sum(iif(behavior=="buy",1,0)) as payment from user where behaveTime between 2017.11.29T14:00:00 : 2017.11.29T17:59:59

re6=select first(behaveTime) as time, sum(iif(behavior=="pv",1,0)) as pageView, sum(iif(behavior=="fav",1,0)) as favorite, sum(iif(behavior=="cart",1,0)) as shoppingCart, sum(iif(behavior=="buy",1,0)) as payment from user where behaveTime between 2017.11.29T18:00:00 : 2017.11.29T21:59:59

re7=select first(behaveTime) as time, sum(iif(behavior=="pv",1,0)) as pageView, sum(iif(behavior=="fav",1,0)) as favorite, sum(iif(behavior=="cart",1,0)) as shoppingCart, sum(iif(behavior=="buy",1,0)) as payment from user where behaveTime between 2017.11.29T22:00:00 : 2017.11.29T23:59:59

re=unionAll([re1,re2,re3,re4,re5,re6,re7],false)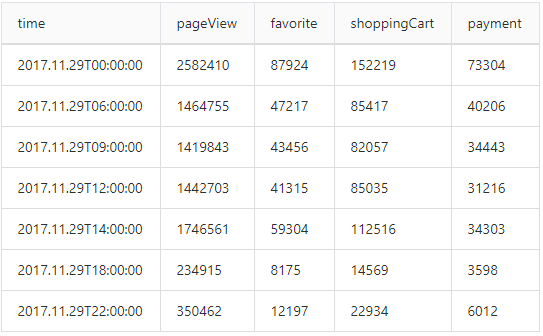
这种方法比较简单,但是需要编写大量重复代码。当然也可以把重复代码封装成函数。
def calculateBehavior(startTime,endTime){
    return select first(behaveTime) as time, sum(iif(behavior=="pv",1,0)) as pageView, sum(iif(behavior=="fav",1,0)) as favorite, sum(iif(behavior=="cart",1,0)) as shoppingCart, sum(iif(behavior=="buy",1,0)) as payment from user where behaveTime between startTime : endTime
}
这样只需要指定时间段的起始时间即可。
另外一种方法是通过DolphinDB的Map-Reduce框架来完成。例如,统计工作日2017.11.29(周三)的用户行为。
def caculate(t){
	return select first(behaveTime) as time, sum(iif(behavior=="pv",1,0)) as pageView, sum(iif(behavior=="fav",1,0)) as favorite, sum(iif(behavior=="cart",1,0)) as shoppingCart, sum(iif(behavior=="buy",1,0)) as payment from t
}
ds1 = repartitionDS(<select * from user>, `behaveTime, RANGE,2017.11.29T00:00:00 2017.11.29T06:00:000 2017.11.29T09:00:00 2017.11.29T12:00:00 2017.11.29T14:00:00 2017.11.29T18:00:00 2017.11.29T22:00:00 2017.11.29T23:59:59)
WedBehavior = mr(ds1, caculate, , unionAll{, false})
我们使用repartitionDS函数对user表重新按照时间范围来分区(不改变user表原来的分区方式),并生成多个数据源,然后通过mr函数,对数据源进行并行计算。DolphinDB会把caculate函数应用到各个数据源上,然后把各个结果合并。
工作日,凌晨(0点到6点)淘宝APP的使用率最高,其次是下午(14点到16点)。
统计周六(2017.11.25)和周日(2017.11.26)的用户行为:
ds2 = repartitionDS(<select * from user>, `behaveTime, RANGE,2017.11.25T00:00:00 2017.11.25T06:00:000 2017.11.25T09:00:00 2017.11.25T12:00:00 2017.11.25T14:00:00 2017.11.25T18:00:00 2017.11.25T22:00:00 2017.11.25T23:59:59)
SatBehavior = mr(ds2, caculate, , unionAll{, false})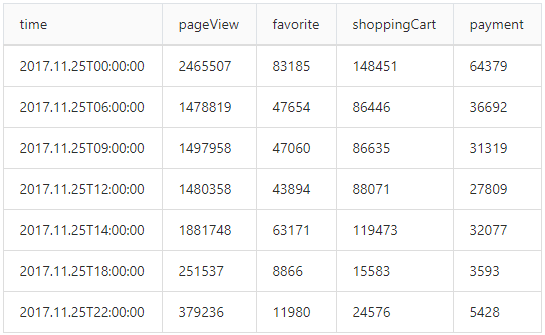
ds3 = repartitionDS(<select * from user>, `behaveTime, RANGE,2017.11.26T00:00:00 2017.11.26T06:00:000 2017.11.26T09:00:00 2017.11.26T12:00:00 2017.11.26T14:00:00 2017.11.26T18:00:00 2017.11.26T22:00:00 2017.11.26T23:59:59)
SunBehavior = mr(ds3, caculate, , unionAll{, false})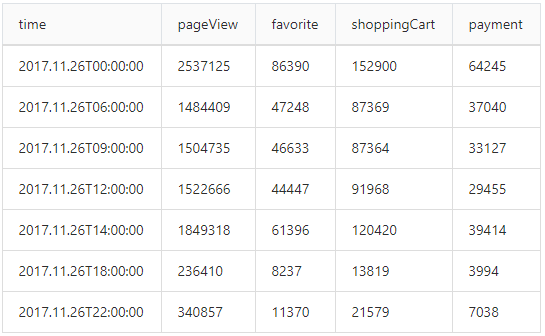
周六和周日各个时间段淘宝APP的使用率都比工作日的使用率要高。同样地,周六日淘宝APP使用高峰是凌晨(0点到6点)。
3. 商品分析
allItems=select distinct(itemID) from user4142583
在这9天中,一共涉及到4,142,583种商品。
统计每个商品的购买次数:
itemBuyTimes=select count(userID) as times from user where behavior="buy" group by itemID order by times desc统计销量前20的商品:
salesTop=select top 20 * from itemBuyTimes order by times descID为3122135的商品销量最高,一共有1,408次购买。
统计各个购买次数下商品的数量:
buyTimesItemNum=select count(itemID) as itemNums from itemBuyTimes group by times order by itemNums desc结果显示,绝大部分(370,747种)商品在这9天中都只被购买了一次,占所有商品的8.94%。购买次数越多,涉及到的商品数量越少。
统计所有商品的用户行为数量:
allItemsInfo=select sum(iif(behavior=="pv",1,0)) as pageView, sum(iif(behavior=="fav",1,0)) as favorite, sum(iif(behavior=="cart",1,0)) as shoppingCart, sum(iif(behavior=="buy",1,0)) as payment from user group by itemID 统计浏览量前20的商品:
pvTop=select top 20 itemID,pageView from allItemsInfo order by pageView desc浏览量最高的商品ID为812879,共有29,720次浏览,但是销量仅为135,没有进入到销量前20。
统计销量前20的商品各个用户行为的数量:
select * from ej(salesTop,allItemsInfo,`itemID) order by times desc销量最高的商品3122135的浏览量为1777,没有进入浏览量前20,从浏览到购买的转化率高达79.2%,该商品有可能是刚需用品,用户不需要太多浏览就决定购买。
扩展练习:
(1)计算2017.11.25每小时淘宝APP的购买率(购买率=购买次数/总行为次数*100%)
(2)找出购买次数最多的用户以及他购买最多的商品
(3)计算商品ID为3122135的商品在各个时间段中的购买次数
(4)统计每个类别每个行为的次数
(5)计算每个类别中销量最高的商品
本教程仅供学习使用。
使用过程中有任何问题欢迎加入智臾科技:DolphinDB技术交流群,内含二维码