【时间】2018.11.12
【题目】matplotlib中的plt.figure()、plt.subplot()、plt.subplots()、add_subplots以及add_axes的使用
概述
本文是博文https://blog.csdn.net/m0_37362454/article/details/81511427的简要概括,具体内容请看原博文。主要讲述了matplotlib中的plt.figure()、plt.subplot()、plt。subplots()\add_subplots以及add_axes的语法与使用方法。
一.plt.figure语()---在plt中绘制一张图片
1.1figure语法说明
figure(num=None, figsize=None, dpi=None, facecolor=None, edgecolor=None, frameon=True)
- num:图像编号或名称,数字为编号 ,字符串为名称
- figsize:指定figure的宽和高,单位为英寸;
- dpi参数指定绘图对象的分辨率,即每英寸多少个像素,缺省值为80 1英寸等于2.5cm,A4纸是 21*30cm的纸张
- facecolor:背景颜色
- edgecolor:边框颜色
- frameon:是否显示边框
1.2例子
【代码】:
import matplotlib.pyplot as plt
fig=plt.figure(figsize=(4,3),facecolor='blue')
plt.show()
【运行结果】:

2.subplot--创建单个子图
2.1.subplot语法
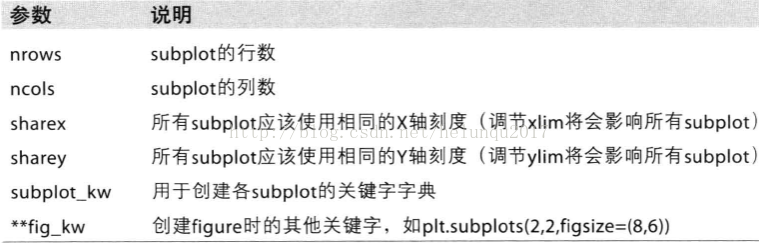
subplot(nrows,ncols,sharex,sharey,subplot_kw,**fig_kw)
2.2例子
【代码】
import numpy as np
import matplotlib.pyplot as plt
x = np.arange(0, 100)

plt.subplot(221)
plt.plot(x, x)
#作图2
plt.subplot(222)
plt.plot(x, -x)
#作图3
plt.subplot(223)
plt.plot(x, x ** 2)
plt.grid(color='r', linestyle='--', linewidth=1,alpha=0.3)
#作图4
plt.subplot(224)
plt.plot(x, np.log(x))
plt.show()
【运行结果】

三.subplots--创建多个子图
3.1subplots语法
subplots参数与subplots相似。两者都可以规划figure划分为n个子图,但每条subplot命令只会创建一个子图,而一条subplots就可以将所有子图创建好。
3.例子
【代码】
import numpy as np
import matplotlib.pyplot as plt

x = np.arange(0, 100)
#划分子图
fig,axes=plt.subplots(2,2)
ax1=axes[0,0]
ax2=axes[0,1]
ax3=axes[1,0]
ax4=axes[1,1]

#作图1
ax1.plot(x, x)
#作图2
ax2.plot(x, -x)
#作图3
ax3.plot(x, x ** 2)
ax3.grid(color='r', linestyle='--', linewidth=1,alpha=0.3)
#作图4
ax4.plot(x, np.log(x))
plt.show()
【运行结果】

四、add_subplot方法----给figure新增子图
4.1语法
add_subplot()的作用与subplot一样,用于新增子图。具体如下:
#新建figure对象
fig=plt.figure()
#新建子图1,(2,2,1)表示创建2x2子图中的第一个
ax1=fig.add_subplot(2,2,1)
4.2 例子
【代码】
import numpy as np
import matplotlib.pyplot as plt
x = np.arange(0, 100)
#新建figure对象
fig=plt.figure()
#新建子图1
ax1=fig.add_subplot(2,2,1)
ax1.plot(x, x)
#新建子图2
ax3=fig.add_subplot(2,2,2)
ax3.plot(x, x ** 2)
ax3.grid(color='r', linestyle='--', linewidth=1,alpha=0.3)
#新建子图3
ax4=fig.add_subplot(2,2,3)
ax4.plot(x, np.log(x))
plt.show()
【运行结果】

五、add_axes方法----新增子区域
5.1语法
add_axes为新增子区域,该区域可以坐落在figure内任意位置,且该区域可任意设置大小。具体如下:
fig.add_axes([left, bottom, width, height])
其中left, bottom表示左边以及下边的起始位置,width, heigh表示宽高占原fig的比例。比如:
left, bottom, width, height = 0.1, 0.1, 0.8, 0.8 表示子区域从figure 10%的位置开始绘制, 宽高是figure的80%
5.2例子
【代码】:
import matplotlib.pyplot as plt

#新建figure
fig = plt.figure()
# 定义数据
x = [1, 2, 3, 4, 5, 6, 7]
y = [1, 3, 4, 2, 5, 8, 6]
#新建区域ax1
#figure的百分比,从figure 10%的位置开始绘制, 宽高是figure的80%
left, bottom, width, height = 0.1, 0.1, 0.8, 0.8
# 获得绘制的句柄
ax1 = fig.add_axes([left, bottom, width, height])
ax1.plot(x, y, 'r')
ax1.set_title('area1')

#新增区域ax2,嵌套在ax1内
left, bottom, width, height = 0.2, 0.6, 0.25, 0.25
# 获得绘制的句柄
ax2 = fig.add_axes([left, bottom, width, height])
ax2.plot(x,y, 'b')
ax2.set_title('area2')
plt.show()
【运行结果】
