文章目录
3、Jmeter Prometheus 性能测试数据可视化平台
一、前言
用jmeter做性能压测,压测出来的报告都是用jmeter原生自带的HTML测试报告。
Html报告对于压测性能分析来说已能满足,接上一篇大家已经对Jmeter + influxdb + Grafana 方式来搭建jmeter性能压测的监控,优化性能测试报告和实现持续压测和监控。已有一定的了解,咋们接着讲解 Jmeter + prometheus-pl + Prometheus的搭建方案。
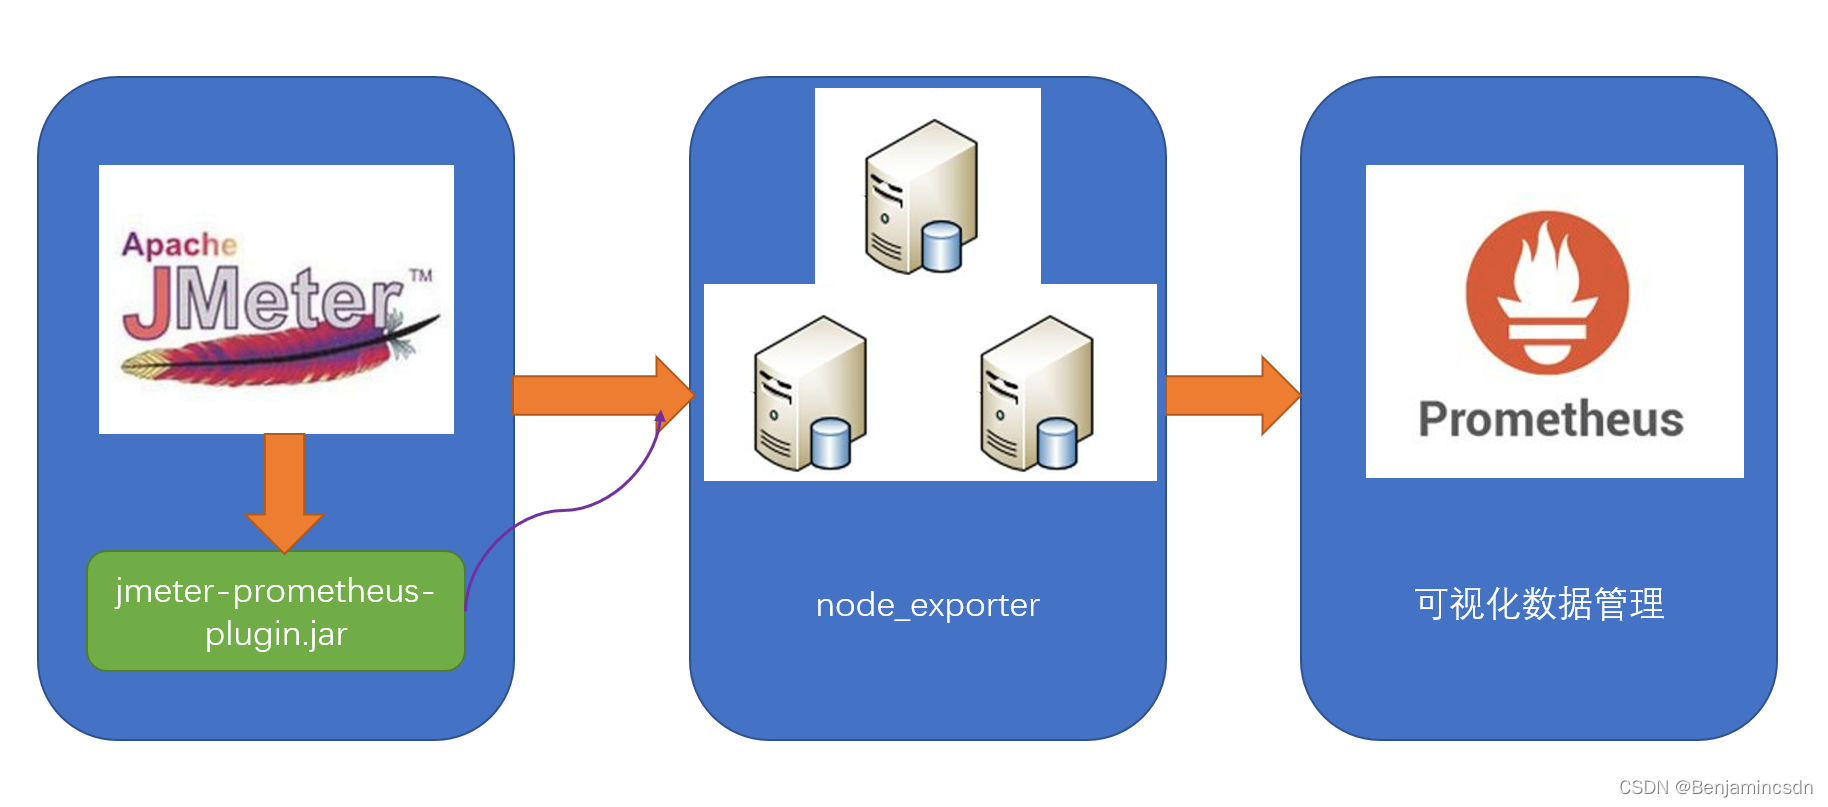
数据流转流程图

Jmeter + prometheus-plugin + Prometheus 演示图.png
二、Jmeter 性能测试持续可视化环境搭建
1、Jmeter
1.1 Jmeter 简介
Apache JMeter是Apache组织开发的基于Java的压力测试工具。用于对软件做压力测试,它最初被设计用于Web应用测试,但后来扩展到其他测试领域。 它可以用于测试静态和动态资源,例如静态文件、Java 小服务程序、CGI 脚本、Java 对象、数据库、FTP 服务器, 等等。

1.2 Jmeter 环境搭建
https://blog.csdn.net/qq_25305833/article/details/122155194jmeter原生自带的HTML测试报告演示

2、jmeter-prometheus-plugin
这个JMeter插件是高度可配置的监听器(和配置元素),允许用户定义自己的度量(名称、类型等),并通过Prometheus/metrics API将它们公开给Prometheus服务器。
简易理解:Jmeter插件,Jmeter配置jar插件后运行默认启动端口9270,访问 ip:9270 网站可查阅Jmeter性能测试数据,数据供Prometheus读取数据后以数据库可视化形式展示
http://127.0.0.1:9270/metrics
“插播”这里暂无讲解仅拓展
node_exporter(节点导出器)
下载地址:
https://prometheus.io/download/
打开页面


3、Prometheus(普罗米修斯)
3.1 Prometheus 简介
Prometheus非常适合记录任何纯数字时间序列。它既适合以机器为中心的监视,也适合监视高度动态的面向服务的体系结构。在微服务世界中,它对多维数据收集和查询的...
3.2 Prometheus 环境搭建
官方下载地址
https://prometheus.io/download/官方github
https://github.com/prometheus/prometheus资源展示图

执行Linux二进制文件下载
wget https://github.com/prometheus/prometheus/releases/download/v2.32.1/prometheus-2.32.1.linux-amd64.tar.gz执行安装
1.创建目录
    > mkdir prometheus

2.解压压缩包
    > tar -zxvf prometheus.tar.gz

3.修改解压文件夹名称
    > mv prometheus-2.26.0.linux-amd64 prometheus

4.进入prometheus目录下
    > cd prometheus

5.启动服务
    > ./prometheus --config.file=prometheus.yml &
版本查询
[root@localhost prometheus-2.32.1.linux-amd64]# prometheus --version
prometheus, version 2.32.1 (branch: HEAD, revision: 41f1a8125e664985dd30674e5bdf6b683eff5d32)
build user: root@54b6dbd48b97
build date: 20211217-22:08:06
go version: go1.17.5
platform: linux/amd64
查看运行状态
[root@localhost prometheus-2.32.1.linux-amd64]# systemctl status prometheus
● prometheus.service - Prometheus
Loaded: loaded (/etc/systemd/system/prometheus.service; enabled; vendor preset: disabled)
Active: active (running) since Mon 2022-01-03 17:19:35 CST; 8min ago
Docs: https://prometheus.io/
Main PID: 893 (prometheus)
CGroup: /system.slice/prometheus.service
└─893 /root/Jmeter/prometheus-2.32.1.linux-amd64/bin/prometheus --config.file=/root/Jmeter/prometheus-2.32.1.linux-amd64/cfg/prometheus.yml --storage.tsdb.path=/root/J...Jan 03 17:19:43 localhost.localdomain prometheus[893]: ts=2022-01-03T09:19:43.051Z caller=main.go:897 level=info msg="Server is ready to receive web requests."
Jan 03 17:20:00 localhost.localdomain prometheus[893]: ts=2022-01-03T09:20:00.270Z caller=compact.go:518 level=info component=tsdb msg="write block" mint=1640678400000 ...9.093832ms
Jan 03 17:20:00 localhost.localdomain prometheus[893]: ts=2022-01-03T09:20:00.305Z caller=head.go:812 level=info component=tsdb msg="Head GC completed" duration=795.391µs
Jan 03 17:20:00 localhost.localdomain prometheus[893]: ts=2022-01-03T09:20:00.456Z caller=compact.go:518 level=info component=tsdb msg="write block" mint=1640685605729 ...1.228066ms
Jan 03 17:20:00 localhost.localdomain prometheus[893]: ts=2022-01-03T09:20:00.457Z caller=head.go:812 level=info component=tsdb msg="Head GC completed" duration=1.156974ms
Jan 03 17:20:00 localhost.localdomain prometheus[893]: ts=2022-01-03T09:20:00.458Z caller=checkpoint.go:98 level=info component=tsdb msg="Creating checkpoint" from_segm...0692800000
Jan 03 17:20:00 localhost.localdomain prometheus[893]: ts=2022-01-03T09:20:00.518Z caller=head.go:981 level=info component=tsdb msg="WAL checkpoint complete" first=8 la...0.143847ms
Jan 03 17:20:00 localhost.localdomain prometheus[893]: ts=2022-01-03T09:20:00.678Z caller=compact.go:459 level=info component=tsdb msg="compact blocks" count=2 mint=164...59.70261ms
Jan 03 17:20:00 localhost.localdomain prometheus[893]: ts=2022-01-03T09:20:00.691Z caller=db.go:1279 level=info component=tsdb msg="Deleting obsolete block" block=01FQZ...TKMNVG73XM
Jan 03 17:20:00 localhost.localdomain prometheus[893]: ts=2022-01-03T09:20:00.716Z caller=db.go:1279 level=info component=tsdb msg="Deleting obsolete block" block=01FQZ...0GPST2F7AH
Hint: Some lines were ellipsized, use -l to show in full.
设置开机启动、临时启动方法
systemctl start prometheus
systemctl enable prometheus
3.3 Prometheus 访问
默认访问端口 :
IP:9090

4、小节
第二点主要讲解Centos下如何搭建Jmeter和Prometheus环境。
三、Jmeter + Prometheus 数据联动调试
1、Jmeter 脚本示例
1.1 Jmeter 依赖环境配置
Jmeter依赖包配置目录
.\apache-jmeter-5.4.1\lib\ext

jmeter-prometheus-plugin 官方github地址
https://github.com/johrstrom/jmeter-prometheus-pluginjmeter-prometheus-plugin 依赖包下载地址
https://search.maven.org/remotecontent?filepath=com/github/johrstrom/jmeter-prometheus-plugin/0.6.0/jmeter-prometheus-plugin-0.6.0.jar1.2 Jmeter jmx脚本配置示例 示例一
Theead Group > Listener

Backend Listener 配置
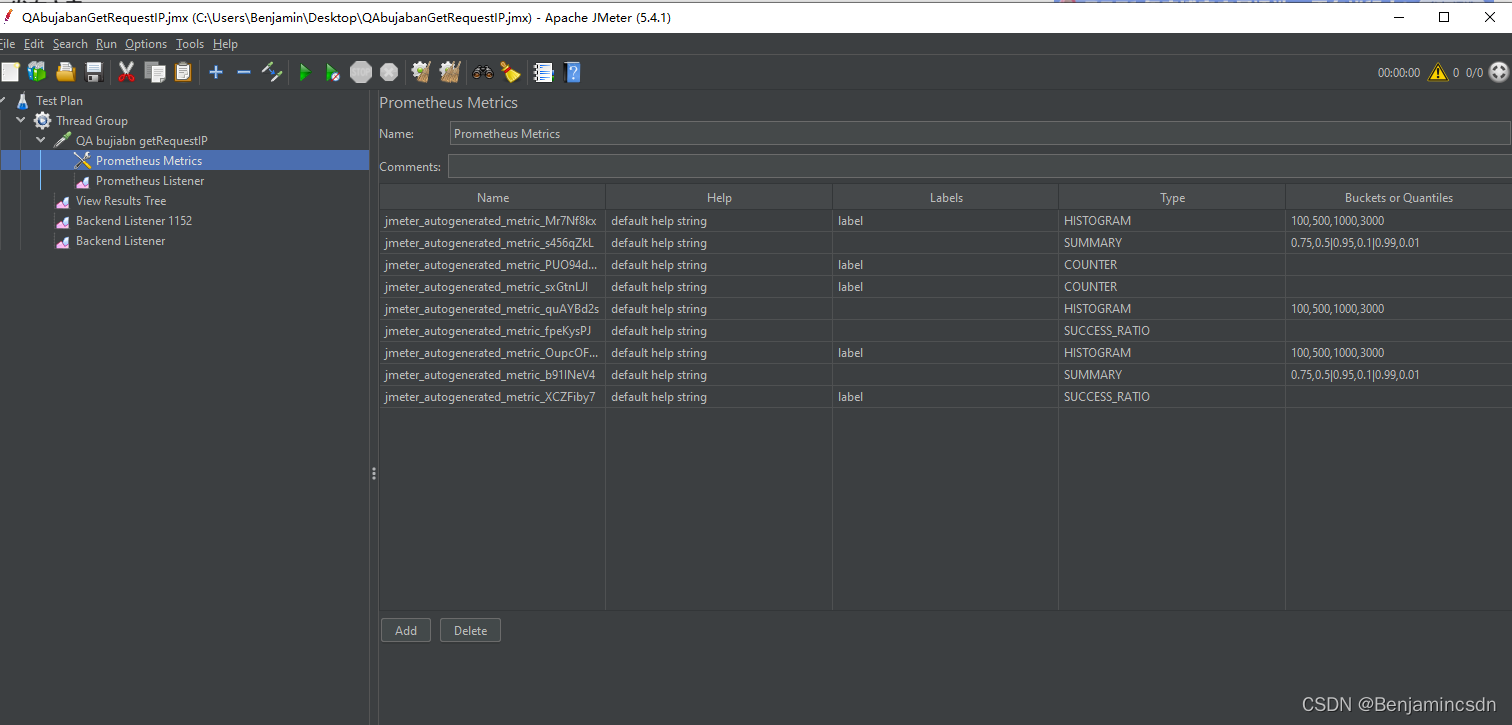
1.3 Jmeter jmx脚本配置示例 示例二
Theead Group > Listener

Backend Listener 配置

1.4 Jmeter 脚本运行
持续运行jmx脚本生成数据,Prometheus插件Jar运行后默认启动 ip:9270 服务端端口数据

2、Prometheus 数据可视化
2.1 Prometheus yml 配置
修改 prometheus.yml 添加插件服务的9270端口
路径:prometheus-2.32.1.linux-amd64/cfg/prometheus.yml

重启Prometheus服务
systemctl restart prometheus
查看Prometheus WEB平台查看是否生效

ps:图为Linux服务器还未执行Jmeter脚本,9270服务端端口还未启动截图
2.2 Prometheus 查看Jmeter性能测试数据
执行前先启动Jmeter脚本并查看9270服务器是否正常

Prometheus > Graph > Expression > 数据过滤检索字段

查看数据 示例一

查看数据 示例二

3、Jmeter Prometheus 性能测试数据可视化平台
1、Jmeter性能测试基础功能
2、Jmeter-prometheus-plugin为Jmeter中的Prometheus插件,提供数据服务端
3、Prometheus过滤数据服务中的数据进行可视化展示
4、小结
建议查阅其他更为完善的技术搭建方案,本文只是简单普及一下示例案例具体实战案例还需深入到项目中,参考更好的落地方案。
http://highcohesionloosecoupling.com/index.php/2017/10/08/jee-performance-jmeter-prometheus-grafana-complete-project-scratch/四、结束语
“工欲善其事,必先利其器”

如果觉得文章写不错,那就点个赞,点个收藏吧。
可关注微信公众号,后期有推文