分享一下我老师大神的人工智能教程!零基础,通俗易懂!http://blog.csdn.net/jiangjunshow
也欢迎大家转载本篇文章。分享知识,造福人民,实现我们中华民族伟大复兴!
先看伟大的高斯分布(Gaussian Distribution)的概率密度函数(probability density function):
f(x)=1√2πσexp(−(x−μ)22σ2)),对应于
np.random.normal(loc=0, scale=1, size)。
采样(sampling)
# 从某一分布(由均值和标准差标识)中获得样本mu, sigma = 0, .1s = np.random.normal(loc=mu, scale=sigma, size=1000)
- 1
- 2
- 3
也可使用scipy库中的相关api(这里的类与函数更符合数理统计中的直觉):
import scipy.stats as stmu, sigma = 0, .1s = st.norm(mu, sigma).rvs(1000)
- 1
- 2
- 3
校验均值和方差:
>>> abs(mu < np.mean(s)) < .01True>>> abs(sigma-np.std(s, ddof=1)) < .01True # ddof,delta degrees of freedom,表示自由度 # 一般取1,表示无偏估计,
- 1
- 2
- 3
- 4
- 5
- 6
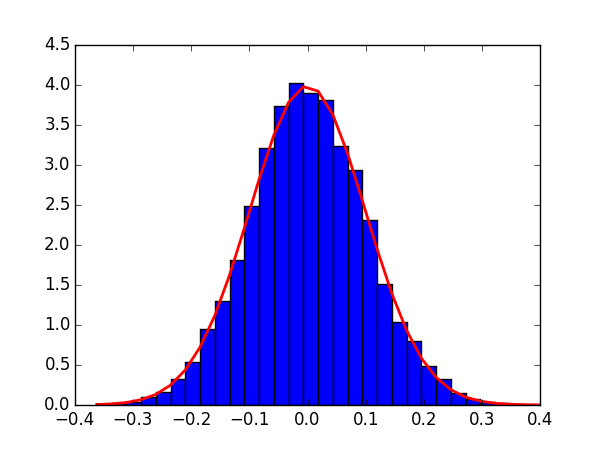
拟合
我们看使用matplotlib.pyplot便捷而强大的语法如何进行高斯分布的拟合:
import matplotlib.pyplot as pltcount, bins, _ = plt.hist(s, 30, normed=True) # normed是进行拟合的关键 # count统计某一bin出现的次数,在Normed为True时,可能其值会略有不同plt.plot(bins, 1./(np.sqrt(2*np.pi)*sigma)*np.exp(-(bins-mu)**2/(2*sigma**2), lw=2, c='r')plt.show()
- 1
- 2
- 3
- 4
- 5
- 6
或者:
s_fit = np.linspace(s.min(), s.max())plt.plot(s_fit, st.norm(mu, sigma).pdf(s_fit), lw=2, c='r')
- 1
- 2
扫描二维码关注公众号,回复:
3905364 查看本文章

给我老师的人工智能教程打call!http://blog.csdn.net/jiangjunshow