教学大纲:教学日历
实验地址:Lab1
本次实验共分为以下三个部分:
- PC Bootstrap
- The Boot Loader
- The Kernel
1.PC Bootstrap
32位PC物理地址空间
+------------------+  <- 0xFFFFFFFF (4GB)
|      32-bit      |
|  memory mapped   |
|     devices      |
|                  |
/\/\/\/\/\/\/\/\/\/\

/\/\/\/\/\/\/\/\/\/\
|                  |
|      Unused      |
|                  |
+------------------+  <- depends on amount of RAM
|                  |
|                  |
| Extended Memory  |
|                  |
|                  |
+------------------+  <- 0x00100000 (1MB)
|     BIOS ROM     |
+------------------+  <- 0x000F0000 (960KB)
|  16-bit devices, |
|  expansion ROMs  |
+------------------+  <- 0x000C0000 (768KB)
|   VGA Display    |
+------------------+  <- 0x000A0000 (640KB)
|                  |
|    Low Memory    |
|                  |
+------------------+  <- 0x00000000
- 低地址空间(640KB)
- 0x00000000-0x000A0000共640KB,“640K ought to be enough for anyone” : )
- 保留空间(384KB)
- 0x00A0000-0x00F0000(320KB),硬件保留地址空间
- 0x000F0000-0X00100000(64KB),ROM,BIOS保留空间
- 其他
- 0x00100000-0xFFFFFFFF
BIOS完成工作的流程
当计算机上电之后,BIOS开始进行自检、对PCI和其他重要设备进行初始化。初始化完成后,从磁盘、软盘或CD-ROM中加载引导程序,然后将控制权交由引导程序。具体点,BIOS会将引导程序加载到0x7C00-0x7DFF这一块物理内存中,然后跳转到0x7C00处执行引导程序。
阅读
计算机是如何启动的?
为什么主引导记录的内存地址是0x7C00?
2.The Boot Loader
一般来讲,引导程序要完成的功能如下:
- 将实模式切换为32位保护模式
- 将内核从磁盘中加载到物理内存中(涉及到基础的IO操作)
- 为内核设置必要的运行时环境(如设置栈空间)
具体到代码,在boot/boot.S中:
  .code16                     # Assemble for 16-bit mode
  cli                         # Disable interrupts
  cld                         # String operations increment

  # Set up the important data segment registers (DS, ES, SS).
  xorw    %ax,%ax             # Segment number zero
  movw    %ax,%ds             # -> Data Segment
  movw    %ax,%es             # -> Extra Segment
  movw    %ax,%ss             # -> Stack Segment

  # Enable A20:
  #   For backwards compatibility with the earliest PCs, physical
  #   address line 20 is tied low, so that addresses higher than
  #   1MB wrap around to zero by default.  This code undoes this.
seta20.1:
  inb     $0x64,%al               # Wait for not busy
  testb   $0x2,%al
  jnz     seta20.1

  movb    $0xd1,%al               # 0xd1 -> port 0x64
  outb    %al,$0x64

seta20.2:
  inb     $0x64,%al               # Wait for not busy
  testb   $0x2,%al
  jnz     seta20.2

  movb    $0xdf,%al               # 0xdf -> port 0x60
  outb    %al,$0x60
此处代码是为在16-bit模式下,进行相关段寄存器的初始化和A20的使能(A20线的介绍)。具体实现比较偏硬件,涉及到接口技术(私以为不必太纠结于此)。PC各端口见这篇文章:Intel x86 I/O端口总结。
  # Switch from real to protected mode, using a bootstrap GDT
  # and segment translation that makes virtual addresses
  # identical to their physical addresses, so that the
  # effective memory map does not change during the switch.
  lgdt    gdtdesc
  movl    %cr0, %eax
  orl     $CR0_PE_ON, %eax
  movl    %eax, %cr0

  # Jump to next instruction, but in 32-bit code segment.
  # Switches processor into 32-bit mode.
  ljmp    $PROT_MODE_CSEG, $protcseg
    .code32                     # Assemble for 32-bit mode

protcseg:
  # Set up the protected-mode data segment registers
  movw    $PROT_MODE_DSEG, %ax    # Our data segment selector
  movw    %ax, %ds                # -> DS: Data Segment
  movw    %ax, %es                # -> ES: Extra Segment
  movw    %ax, %fs                # -> FS
  movw    %ax, %gs                # -> GS
  movw    %ax, %ss                # -> SS: Stack Segment

  # Set up the stack pointer and call into C.
  movl    $start, %esp
  call bootmain

  # If bootmain returns (it shouldn't), loop.
spin:
  jmp spin
这一段代码完成了三件事:
- 开启分段,
- 将CS,DS,SS等段选择子设置成正确的值(设置全局GDT)
- 调用bootmain函数
对GDT等不熟悉的话可以先去了解有关GDT相关的知识
CS被设置为0x8,DS被设置为0x10.CS,DS等都是作为段选择子用的,而段选择子的结构如下:
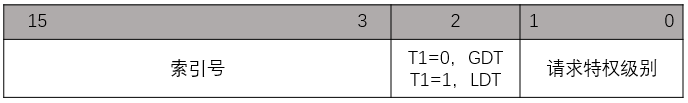
故CS的索引号是1,DS、SS等的索引号为2。之所以设置为这个值,是因为在后面声明了段描述符:
# Bootstrap GDT
.p2align 2                                # force 4 byte alignment
gdt:
  SEG_NULL				# null seg
  SEG(STA_X|STA_R, 0x0, 0xffffffff)	# code seg
  SEG(STA_W, 0x0, 0xffffffff)	        # data seg
其中SEG()是一个定义在inc/mmu.h中的一个宏:
#define SEG_NULL						\
	.word 0, 0;						\
	.byte 0, 0, 0, 0
#define SEG(type,base,lim)					\
	.word (((lim) >> 12) & 0xffff), ((base) & 0xffff);	\
	.byte (((base) >> 16) & 0xff), (0x90 | (type)),		\
		(0xC0 | (((lim) >> 28) & 0xf)), (((base) >> 24) & 0xff)
意思就是声明了三个段描述符,第一个(偏移量为0,共64位)全为0,第二个(偏移量为1,共64位)是CS段,第三个(偏移量为2,共64位)是数据段。所以,这就和前面的将CS设置为0x8(偏移量为1),DS、SS设置为0x10(偏移量为2)相对应。至于第一个段描述符为何全为0,这是Intel文档规定的,在此不做深究。
现在我们再来看看bootmain函数里面的内容。
bootmain函数如下:
void
bootmain(void)
{
	struct Proghdr *ph, *eph;

	// read 1st page off disk
	readseg((uint32_t) ELFHDR, SECTSIZE*8, 0);

	// is this a valid ELF?
	if (ELFHDR->e_magic != ELF_MAGIC)
		goto bad;

	// load each program segment (ignores ph flags)
	ph = (struct Proghdr *) ((uint8_t *) ELFHDR + ELFHDR->e_phoff);
	//因为ph是(struct Proghdr*)的指针,所以,eph也是(struct Proghdr*)类型的指针
	eph = ph + ELFHDR->e_phnum;
	for (; ph < eph; ph++)
		// p_pa is the load address of this segment (as well
		// as the physical address)
		readseg(ph->p_pa, ph->p_memsz, ph->p_offset);

	// call the entry point from the ELF header
	// note: does not return!
	((void (*)(void)) (ELFHDR->e_entry))();

bad:
	outw(0x8A00, 0x8A00);
	outw(0x8A00, 0x8E00);
	while (1)
		/* do nothing */;
}
这段代码完成的功能就是读入8个扇区的内容(ELF可执行文件)至物理内存0x100000(1MB)处,然后根据ELF文件里面的相关信息将相关的程序代码复制到相应的物理内存处。具体的ELF文件相关知识详见此:ELF。复制完成后,调用内核入口函数,进入到内核中(((void (*)(void)) (ELFHDR->e_entry))() )。
现在回答相关问题。
-
At what point does the processor start executing 32-bit code? What exactly causes the switch from 16- to 32-bit mode?
-
答:在执行完
movl %eax, %cr0ljmp $PROT_MODE_CSEG, $protcseg后。(具体细节还不甚清楚) -
What is the last instruction of the boot loader executed, and what is the first instruction of the kernel it just loaded?
-
答:最后一条指令是
((void (*)(void)) (ELFHDR->e_entry))();第一条指令是应该是位于内存0x100000处的指令,利用gdb调试发现0x100000处的指令为add 0x1bad(%eax),%dh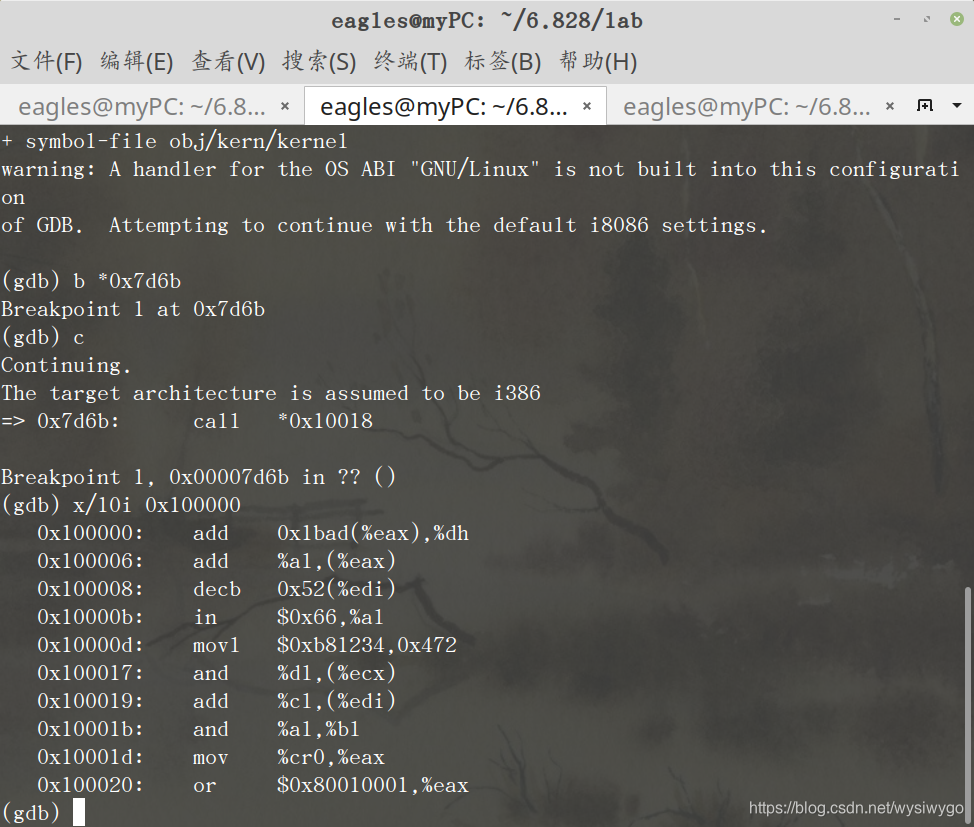
-
Where is the first instruction of the kernel?
-
答:根据obj/boot/boo.asm文件,可以看出bootmain函数最后一句是
7d6b: ff 15 18 00 01 00 call *0x10018.用gdb进行调试,设置断点为b *0x7d6b进行调试: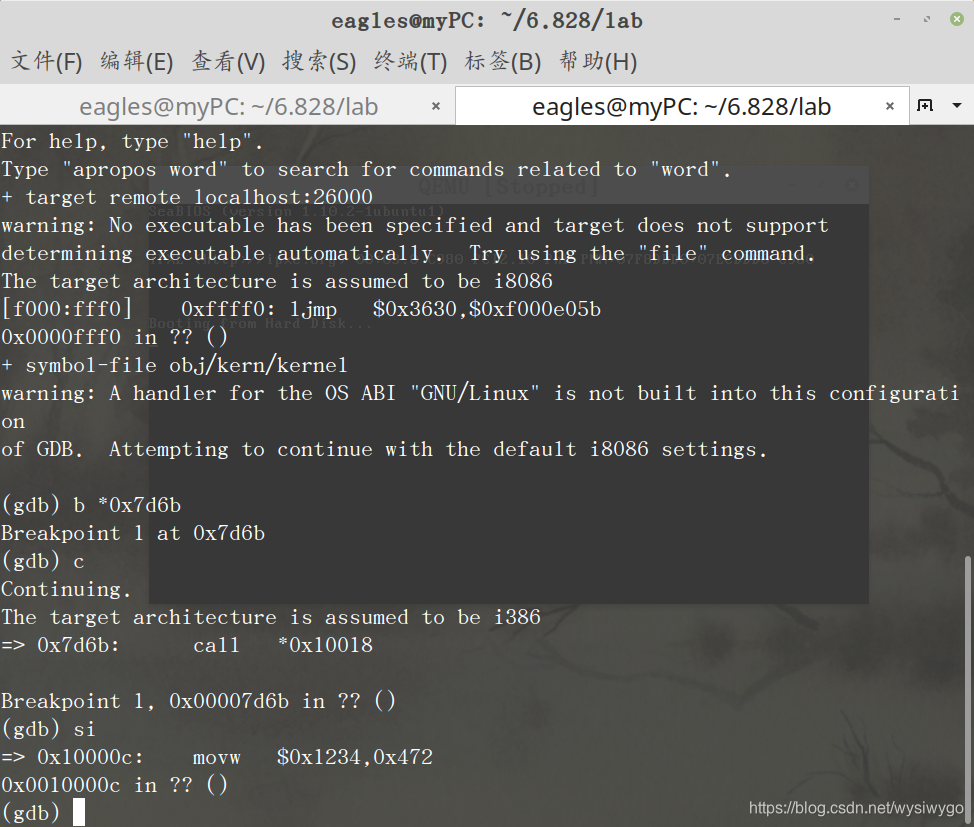 可以看到,内核的第一条指令的地址为0x10000c.
 -
How does the boot loader decide how many sectors it must read in order to fetch the entire kernel from disk? Where does it find this information?
-
答:在boot loader加载了elf的文件头信息到内存之后,根据
ph = (struct Proghdr *) ((uint8_t *) ELFHDR + ELFHDR->e_phoff);和ph = (struct Proghdr *) ((uint8_t *) ELFHDR + ELFHDR->e_phoff);从ELF文件头获得了需要加载的大小。
3.The Kernel
在boot loader将内核引导进入内存后,现在程序的控制权在内核手中。在这一小节,将会完成三件事:
- Using virtual memory to work around position dependence(设置虚拟内存)
- Formatted Printing to the Console(设置相关输出函数)
- The Stack(设置内核堆栈)
设置虚拟内存
预备知识:页目录页表、线性地址到物理地址的转换、MMU工作的流程
完成这一部分的所需要做的工作为:
- 设置好页目录
- 设置好页表
- 将CR3,CR0设置为正确的值
具体到代码中,在kern/entrypgdir.c 中设置了页目录和页表,将虚拟内存[0x00000000,0x00400000)和[0xf0000000,0xf0400000)共同映射到物理内存[0,4MB)上。接下来,在kernel/entry.S中,
	movl	$(RELOC(entry_pgdir)), %eax
	movl	%eax, %cr3
	# Turn on paging.
	movl	%cr0, %eax
	orl	$(CR0_PE|CR0_PG|CR0_WP), %eax
	movl	%eax, %cr0
在链接文件kern/kern.ld中,所有的代码、数据(包括页目录、页表)都是放在虚拟高地址中的,但是此时还为开启虚拟地址,所以存入CR3的应该是页表的真实物理地址,故存入CR3寄存器的是$(RELOC(entry_pgdir))而不直接是entry_pgdir
Exercise 7. Use QEMU and GDB to trace into the JOS kernel and stop at the movl %eax, %cr0. Examine memory at 0x00100000 and at 0xf0100000. Now, single step over that instruction using the stepi GDB command. Again, examine memory at 0x00100000 and at 0xf0100000. Make sure you understand what just happened.
What is the first instruction after the new mapping is established that would fail to work properly if the mapping weren’t in place? Comment out the movl %eax, %cr0 in kern/entry.S, trace into it, and see if you were right.
答:在开启分页之前,0xf0100000处内容为空,当开启映射之后,0xf0100000处的内容和0x001000000处的内容是一样的,因为二者都映射到同一物理地址0x100000处。
设置输出函数
Exercise 8. We have omitted a small fragment of code - the code necessary to print octal numbers using patterns of the form “%o”. Find and fill in this code fragment.
答:在文件 lib/printfmt.c中,找到207行case 'o':,在下面依照case 'd': 写即可,将base改为8:
			num = getint(&ap, lflag);
			if ((long long) num < 0) {
				putch('-', putdat);
				num = -(long long) num;
			}
			base = 8;
			goto number;
			break;
余下的几个小练习题略。
栈
Exercise 9. Determine where the kernel initializes its stack, and exactly where in memory its stack is located. How does the kernel reserve space for its stack? And at which “end” of this reserved area is the stack pointer initialized to point to?
答:设置栈的语句位于kern/entry.S的77行左右
	movl	$0x0,%ebp			# nuke frame pointer

	# Set the stack pointer
	movl	$(bootstacktop),%esp
以及后面的语句
.data
###################################################################
# boot stack
###################################################################
	.p2align	PGSHIFT		# force page alignment
	.globl		bootstack
bootstack:
	.space		KSTKSIZE
	.globl		bootstacktop
bootstacktop:
通过obj/kern/kernel.asm第59行:
	movl	$0x0,%ebp			# nuke frame pointer
f010002f:	bd 00 00 00 00       	mov    $0x0,%ebp

	# Set the stack pointer
	movl	$(bootstacktop),%esp
f0100034:	bc 00 00 11 f0       	mov    $0xf0110000,%esp
可以看到ESP的值被设置为0xf0110000,栈的大小为32KB(KSTSIZE的大小),0xf0110000-32KB=0xf0108000。所以内核栈的范围为0xf0108000-0xf0110000
Exercise 10. To become familiar with the C calling conventions on the x86, find the address of the test_backtrace function in obj/kern/kernel.asm, set a breakpoint there, and examine what happens each time it gets called after the kernel starts. How many 32-bit words does each recursive nesting level of test_backtrace push on the stack, and what are those words?
Note that, for this exercise to work properly, you should be using the patched version of QEMU available on the tools page or on Athena. Otherwise, you’ll have to manually translate all breakpoint and memory addresses to linear addresses.
答:每次调用函数的时候,首先将各参数压入栈,然后将返回地址压入,最后压入EBP,然后将ESP的值赋值给EBP,如此循环,就构成了函数的帧栈
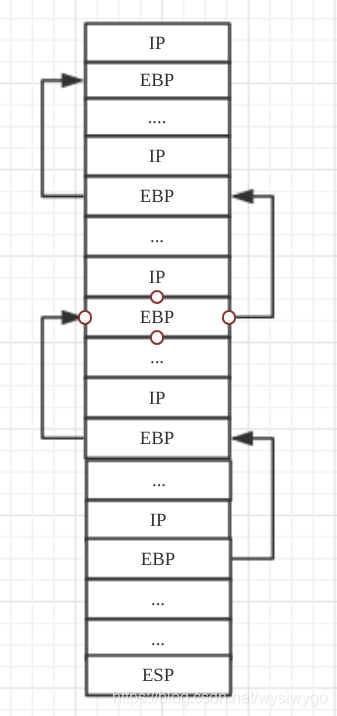
根据gdb进行相应的调试,会发现EBP寄存器会构成链式的结构,具体调试过程略。
Exercise 11. Implement the backtrace function as specified above. Use the same format as in the example, since otherwise the grading script will be confused. When you think you have it working right, run make grade to see if its output conforms to what our grading script expects, and fix it if it doesn’t. After you have handed in your Lab 1 code, you are welcome to change the output format of the backtrace function any way you like.
If you use read_ebp(), note that GCC may generate “optimized” code that calls read_ebp() before mon_backtrace()'s function prologue, which results in an incomplete stack trace (the stack frame of the most recent function call is missing). While we have tried to disable optimizations that cause this reordering, you may want to examine the assembly of mon_backtrace() and make sure the call to read_ebp() is happening after the function prologue.
答:这是在上一题熟悉相关知识的前提下做的。具备了相应的知识后,很容易实现。实现的代码如下
	int *ebp;
	int *ip;
	int *arg;

	cprintf("Stack backtrace:\n");
	//获取当前的ebp
	ebp =(int*)read_ebp();

	while (ebp != 0)
	{
		cprintf("ebp %08x eip %08x args %08x %08x %08x %08x %08x\n",
		ebp,*(ebp+1),*(ebp+2),*(ebp+3),*(ebp+3),*(ebp+4),*(ebp+5)
		);
		ebp = (int*)(*ebp);
	}
	return 0;
Exercise 12. Modify your stack backtrace function to display, for each eip, the function name, source file name, and line number corresponding to that eip.
In debuginfo_eip, where do _STAB* come from? This question has a long answer; to help you to discover the answer, here are some things you might want to do:
look in the file kern/kernel.ld for _STAB*
run objdump -h obj/kern/kernel
run objdump -G obj/kern/kernel
run gcc -pipe -nostdinc -O2 -fno-builtin -I. -MD -Wall -Wno-format -DJOS_KERNEL -gstabs -c -S kern/init.c, and look at init.s.
see if the bootloader loads the symbol table in memory as part of loading the kernel binary
Complete the implementation of debuginfo_eip by inserting the call to stab_binsearch to find the line number for an address.
Add a backtrace command to the kernel monitor, and extend your implementation of mon_backtrace to call debuginfo_eip and print a line for each stack frame of the form:
K> backtrace
Stack backtrace:
ebp f010ff78 eip f01008ae args 00000001 f010ff8c 00000000 f0110580 00000000
kern/monitor.c:143: monitor+106
ebp f010ffd8 eip f0100193 args 00000000 00001aac 00000660 00000000 00000000
kern/init.c:49: i386_init+59
ebp f010fff8 eip f010003d args 00000000 00000000 0000ffff 10cf9a00 0000ffff
kern/entry.S:70: +0
K>
Each line gives the file name and line within that file of the stack frame’s eip, followed by the name of the function and the offset of the eip from the first instruction of the function (e.g., monitor+106 means the return eip is 106 bytes past the beginning of monitor).
Be sure to print the file and function names on a separate line, to avoid confusing the grading script.
Tip: printf format strings provide an easy, albeit obscure, way to print non-null-terminated strings like those in STABS tables. printf("%.*s", length, string) prints at most length characters of string. Take a look at the printf man page to find out why this works.
You may find that some functions are missing from the backtrace. For example, you will probably see a call to monitor() but not to runcmd(). This is because the compiler in-lines some function calls. Other optimizations may cause you to see unexpected line numbers. If you get rid of the -O2 from GNUMakefile, the backtraces may make more sense (but your kernel will run more slowly).
答:这个稍微复杂了点。参考了别人的做法:6.828 操作系统 lab1 实验报告
总结
-
大致的流程
- BIOS
- boos.S
- main.c
- entry.S
-
BIOS
将boot loader加载到0x7c00开始的地方 -
boos.S
开启分段,设置段描述符 -
main.c
将可执行elf文件载入0x10000开始的内存中 -
entry.S
开启分页,设置内核栈
END.
