


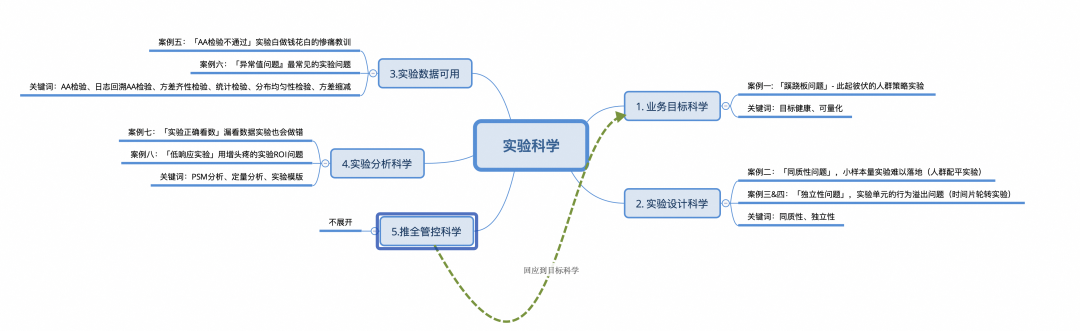

Science of business goals: Growth goals should be long-term, healthy and quantifiable.
▐Case 1: "Skysaw Problem" - successive operational experiments
case analysis
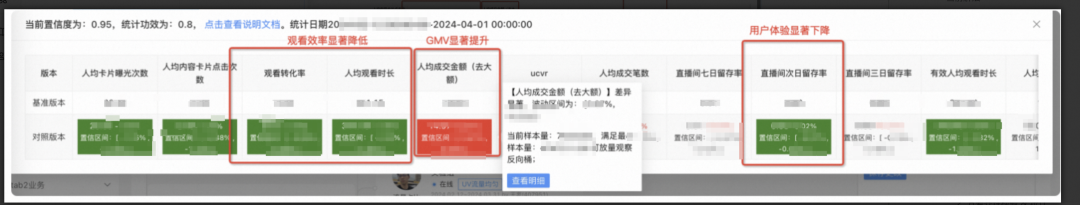
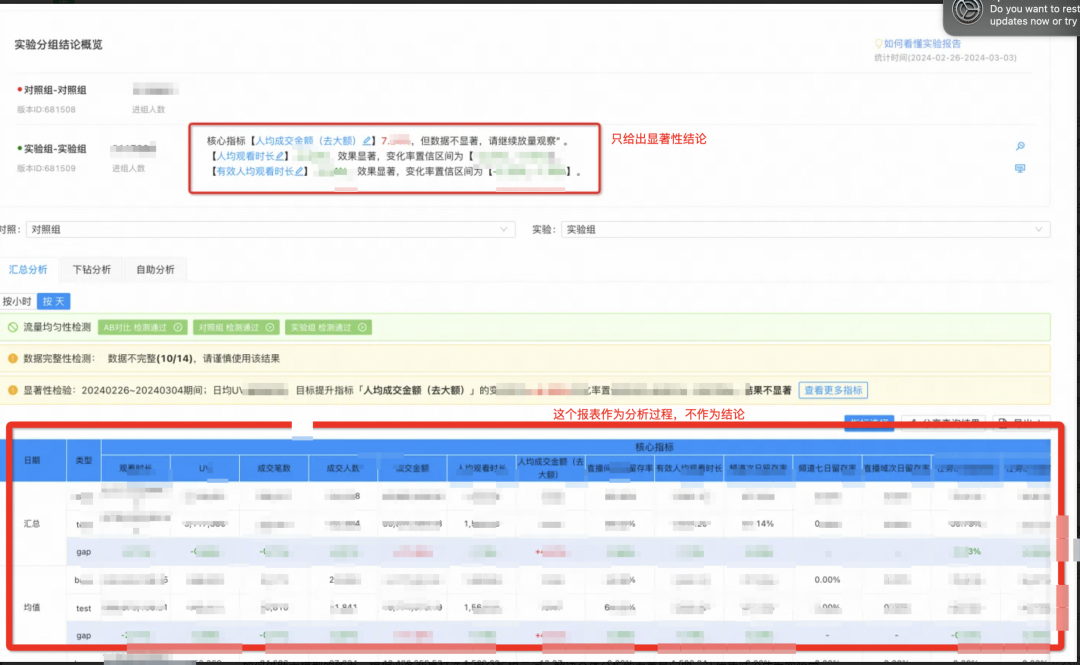
从实验结论可以看出,该实验显著提升人均GMV,同时显著降低用户体验;这类对冲指标在业务中并不少见,例如提高人均成交笔数的同时不降低比单价、提高人均观看时长的同时不降低人均成交金额等等,如果不同的小团队恰好分配到了对冲指标(组织架构常见问题),则大团队需要合理制定目标同时,格外关注对冲指标。
Current solution
-
A large team maintains core indicators and fence indicators, which usually require the determination of business leaders, finance, and BI.
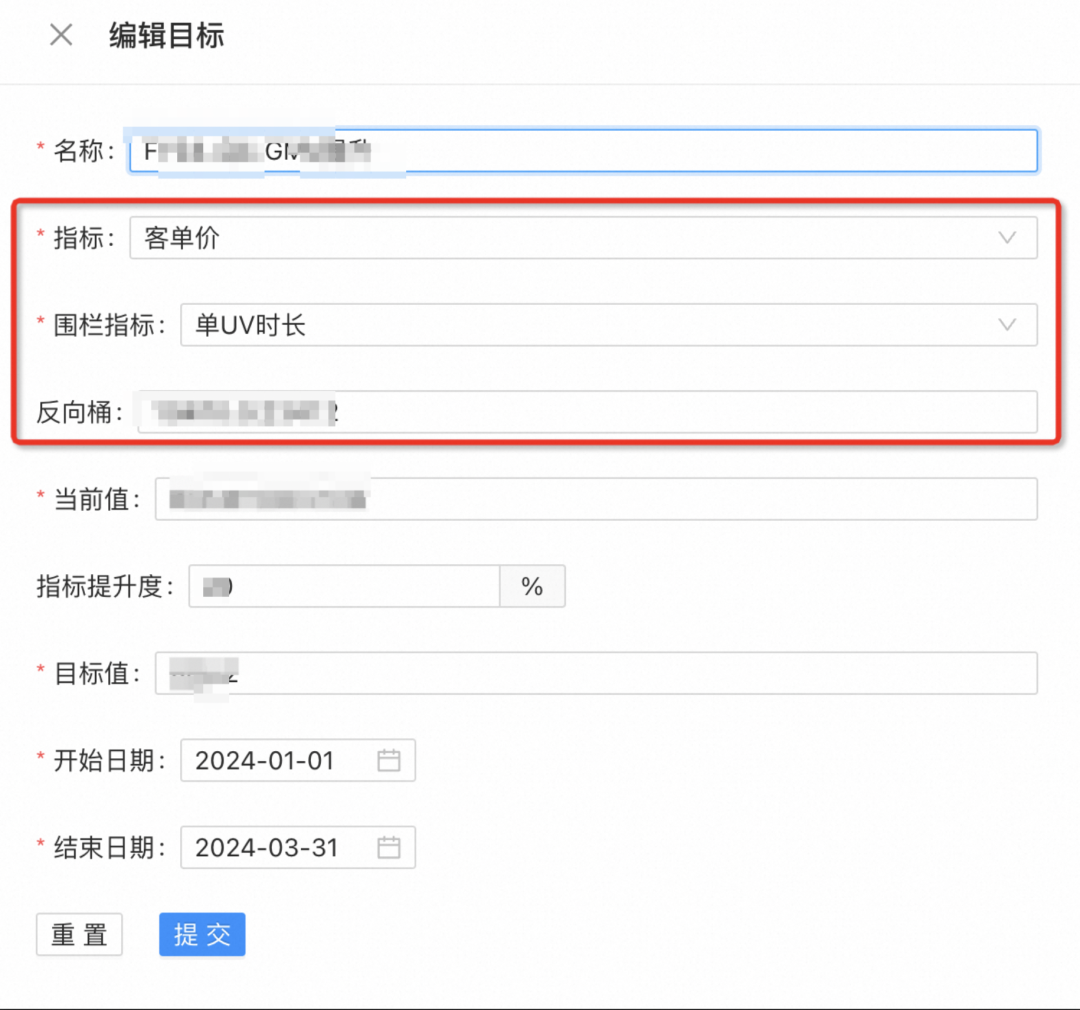
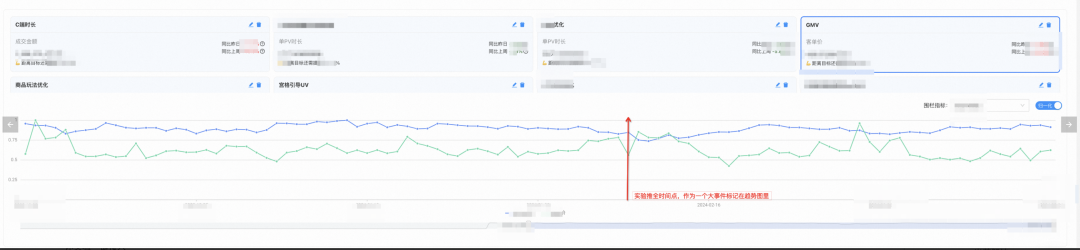
Normalize the trend of rendering core indicators and fence indicators, and observe the intuitive changes caused by the experimental push of all nodes;
-
Combined with the long-term reverse bucket, the incremental value of the experiment is verified. (not shown in the picture)
Thinking: How should business OKR indicators be determined from the perspective of experimental management?
-
OKR is set as an indicator that can be experimentally proven (such as GMV per capita), and this indicator is used to quantitatively evaluate the value of experiments; -
Strict reverse bucket management and control process, and estimate GMV contribution through reverse bucket;

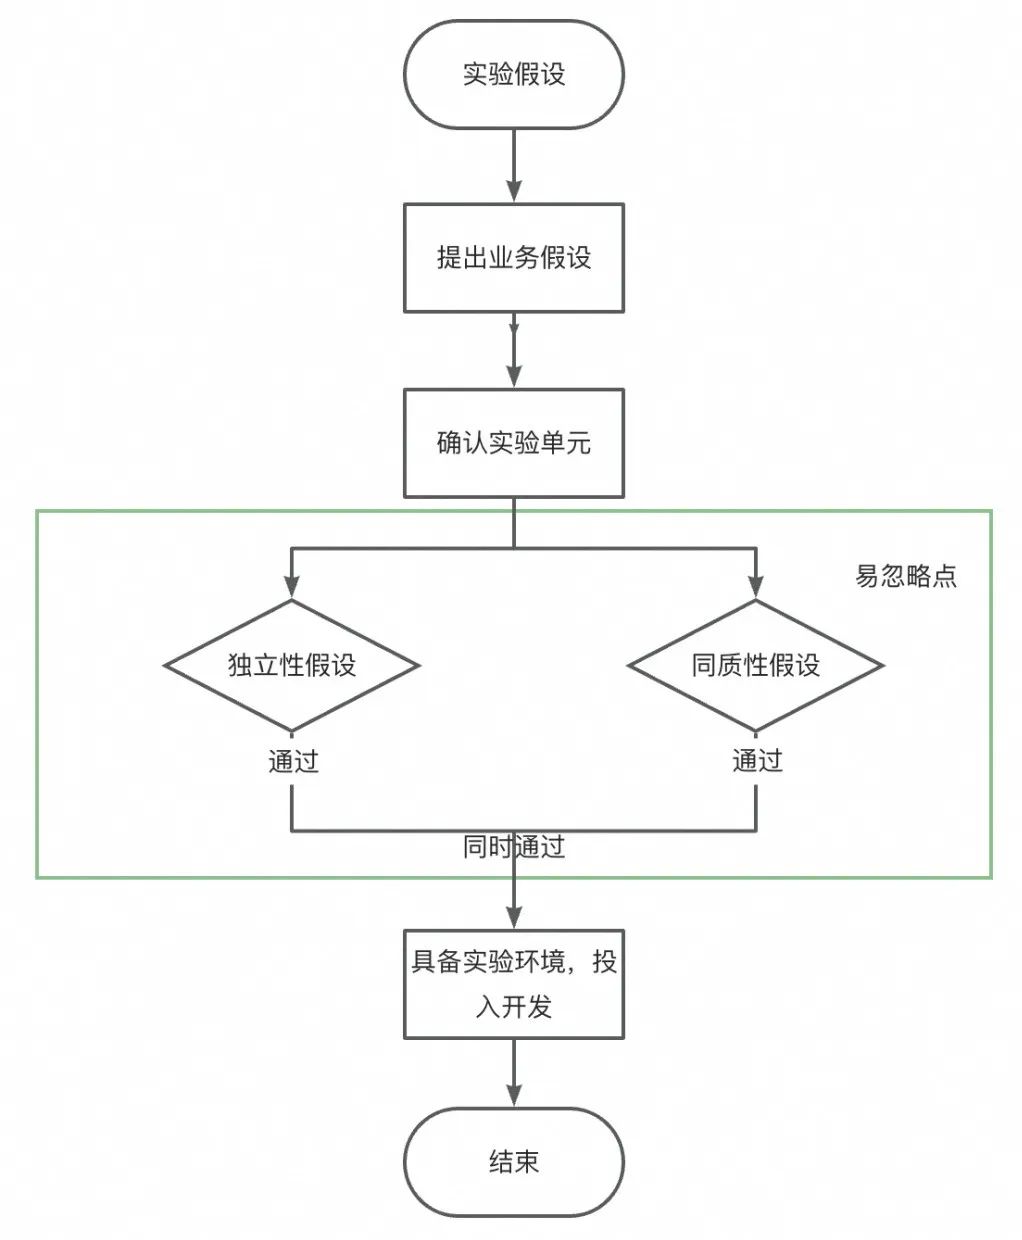
▐Case 2: "Homogeneity problem", small sample size experiment is difficult to conduct: new anchor experiment
case analysis
Business hypothesis: We usually do a lot of strategic experiments to improve the experience of new anchors on Taobao. Taking a certain strategy as an example, we assume that this strategy can effectively improve the enthusiasm of new anchors.
Actual situation: The number of samples of new anchors that can be tested after business screening is small, and the individual differences between anchors are huge. Therefore, the indicators between the two randomly selected sample groups fluctuate greatly, making it impossible to carry out experiments.
Current solution ideas
-
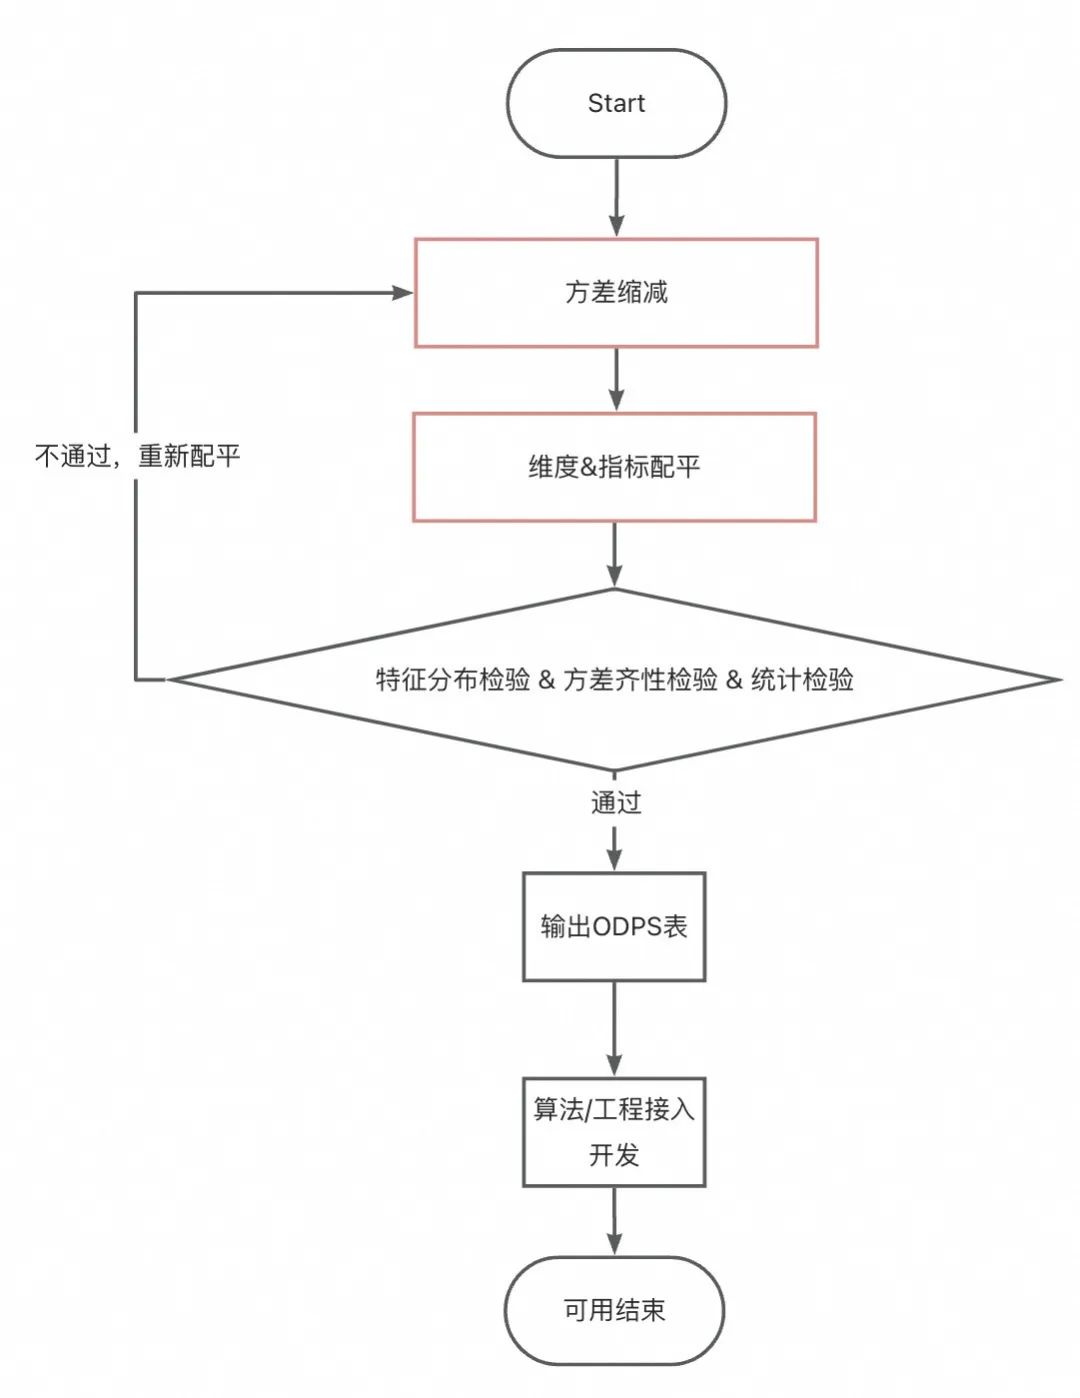
Variance reduction: around the indicators to be verified in the experiment, eliminate an appropriate amount of outliers (note: removing too much will lead to a smaller experimental effect, and removing too little will lead to excessive fluctuations. Empirically, at least keep it to the 99th percentile). If the variance is still too high It is large and can be appropriately processed into a long-term indicator . In this case, the difference in the anchor's single-day transaction amount is too large, so we took the three-day average transaction amount. However, this will cause the experimental data recovery cycle to become longer and the experimental interpretability may become worse . Therefore, it is necessary to clarify the purpose of the experiment before caliber processing. -
Indicator & dimension balancing : Through offline processing, multiple groups of samples with equal indicator data distribution and equal dimension distribution are obtained.
-
If the sample size is not very small and the differences within the groups are not too obvious , you can try simple group balancing , that is, the same proportion of anchors from each group will participate in the experiment. -
If the sample size is too small, or the differences within the group are large , the model can be used to balance indicators and dimensions. In this case, the covariate adaptive randomization method is used , which can stably pass the AA test.
-
AA test: ensure that the grouping results are homogeneous and that the experimental conclusions are usable. This section will be discussed in detail below.
think
Small sample size experiments are often easily ignored due to their small impact on the broader market and difficulty in implementation. However, under refined operations, such experiments have gradually begun to be taken seriously. We also need to pay attention to the "small" of the small sample size. In a real product price reduction case, 500 products were randomly sampled 1,000 times, and it was found that the mean set did not conform to the normal distribution. After adjusting to randomly sampling 10,000 products, The mean begins to show an obvious normal distribution, so the number of samples that can be sampled in the experiment in this context must not be less than 10,000.
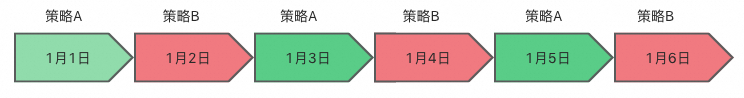
▐Case 3 & 4: "Independence Issue", the overflow of user behavior caused by the community relationship between fans, and the overflow of anchor behavior caused by the traffic competition relationship between anchors. How to conduct these experiments?
case analysis
Current solution
By dividing time into multiple time slices and using each time slice as an independent experimental unit, we can ensure that all users in the same time slice will experience the same strategy. This design effectively avoids the problem of inconsistency in user experience. Similarly, in each time slice, all traffic will be uniformly assigned to a policy. This arrangement fundamentally prevents traffic competition and inconsistency in user experience, ensuring the fairness and effectiveness of the experiment. Time-slice rotation experiments allow us to provide a unified experience for all users at any given moment, maintaining consistency and avoiding potential disruptions during the experiment.
shortcoming:
由于其实验单元为时间,所以可统计样本量较少,导致实验效果评估周期长,同时日期切片容易受热点事件影响,导致实验结论偏差。
由于需保证实验单元的独立性,且日期天然存在延续性,因此要减少日期之间的影响,例如1号的策略会影响到2号凌晨的主播(因为主播的场次容易跨天),所以日期切割需要结合业务特点,灵活选择时间切片大小和切割点。

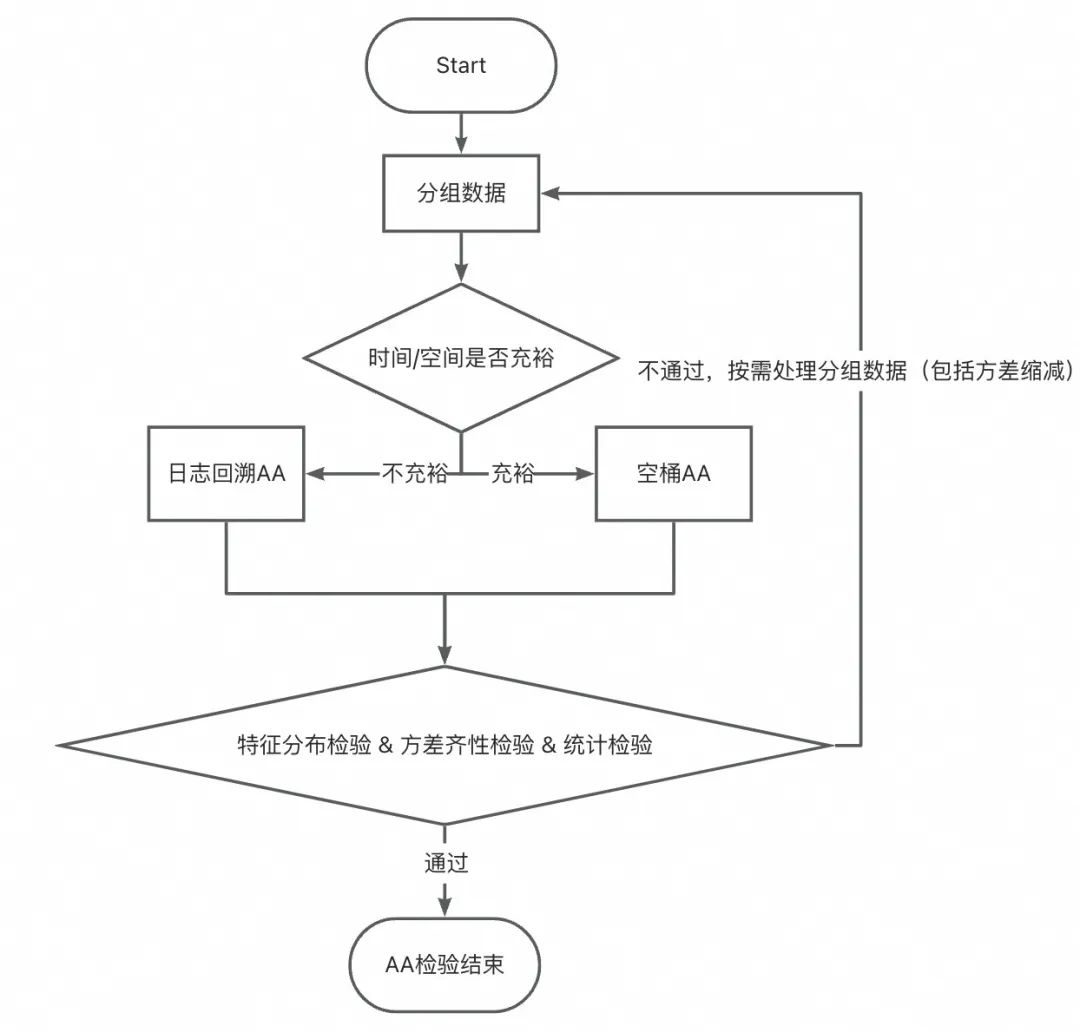
▐ 案例五:「AA检验不通过」在一次下单返红包的实验中,在分析实验数据时才发现用户分布不均匀,导致实验结论严重错误,甚至得出相反结论,浪费实验期间投入的预算等资源。
案例分析
当前解法
1、分布均匀性检验
在这次案例中,实验组和对照组在购买力分层上严重不均,从而导致其核心指标也显著不均,无法获得实验效果。注意:
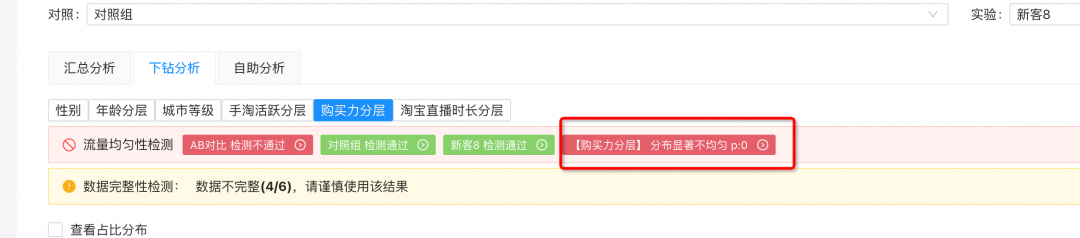
注意:分布不均匀并不一定表示实验数据不可用,本次案例是由于分布不均匀引起了核心指标不同质,导致了实验效果无法验证;
2、方差齐性检验 & 统计检验
在这次案例中,购买力的分布不均已经引起了指标不同质。从下图可以直观理解不同质现象,假设实验组和对照组本身同质,那么他们的数据分布应该都在绿色区域中,随后因为实验组施加了不同策略,导致实验组数据分布从绿色区域移动到了黄色区域。如果实验组未上策略就已经移动到了黄色区域,那么我们是无法证明策略对实验的影响。


图为检验结果
-
统计检验:通过双样本T检验或者多样本ANOVA检验,比较两个独立样本或配对样本的均值差异,具体检验方法可以根据实验样本量大小、样本均衡性情况、样本组数量决定。 -
方差齐性检验:通过Levene's Test或Bartlett's Test来验证实验组和对照组的数据方差是否一致。如果p值大于常用的显著性水平(如0.05),则可以认为组间方差是同质的。
▐ 案例六:「异常值问题』在一次打赏实验中,发现实验效果波动较大,排查后发现榜一大哥竟能左右实验效果
案例分析
在这个案例中,由于实验的用户一致性,榜一大哥会持续进入同一个实验组,于是大哥上线的天数该实验组效果就很好,大哥不在的天数则表现平平。这种实验如果没有找到这个异常值,按照常规经验难以进行分析和迭代。
当前解法
方差缩减:因为异常值会影响到指标的均值、方差,因此异常值除了引起汇总结果的波动外,实验的AA检验、AB检验也都会受影响。目前根据参与实验的实际样本量,采用常用手段:四分位数间距法、标准差法、Z-Score、孤立森林等方式做动态处理。
思考
A/B实验是验证因果关系的黄金标准。错误的因,只会带来错误的果。做好数据可用性验证,保证因果关系的正确发现,是沉淀实验经验,建立实验文化的必要基础。

在获得可用的数据基础后,我们开始关注实验分析的问题,图示为一个简化的实验分析流程。
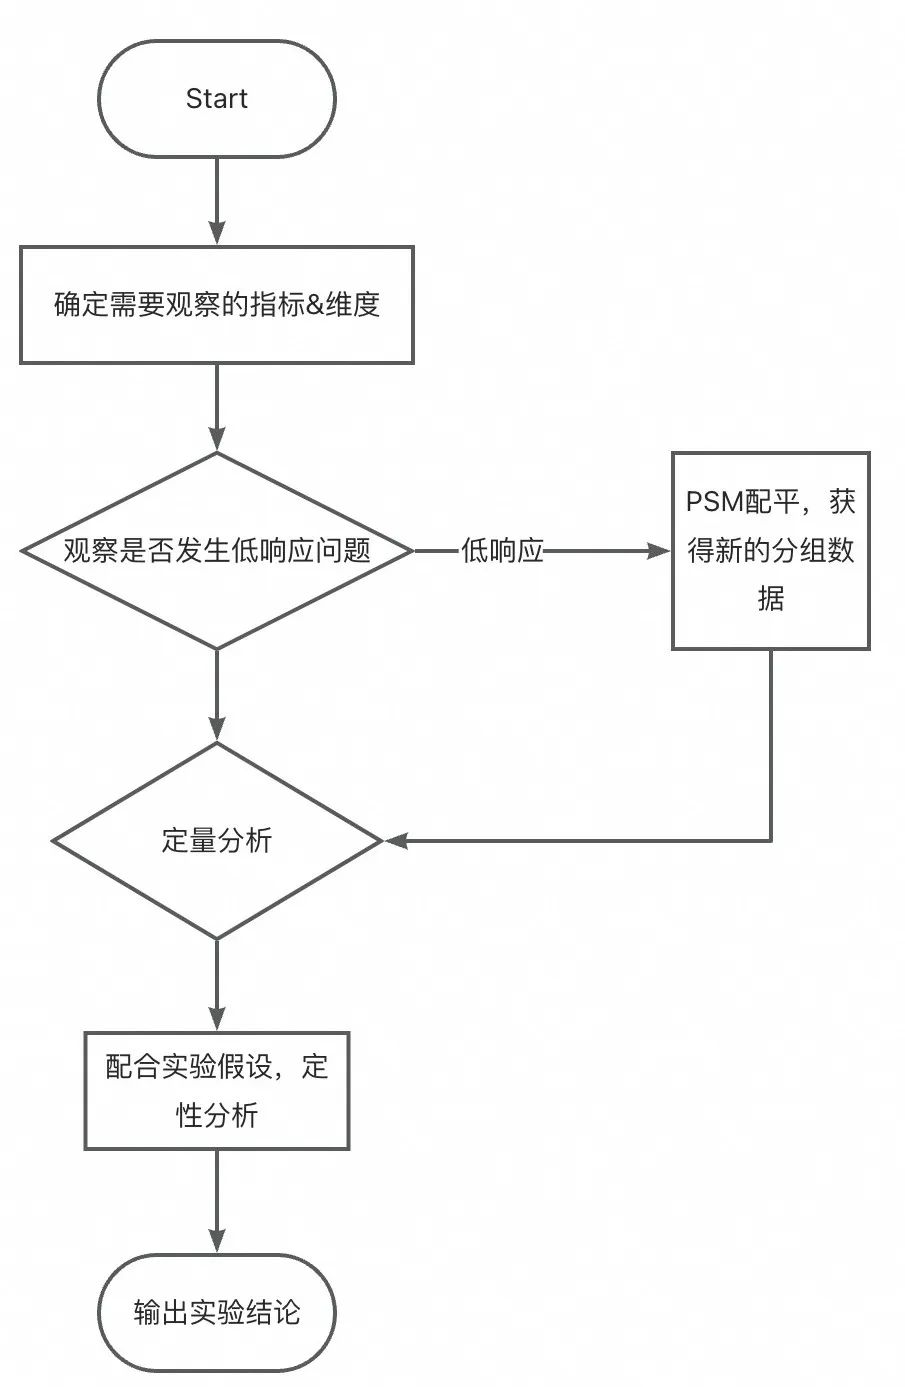
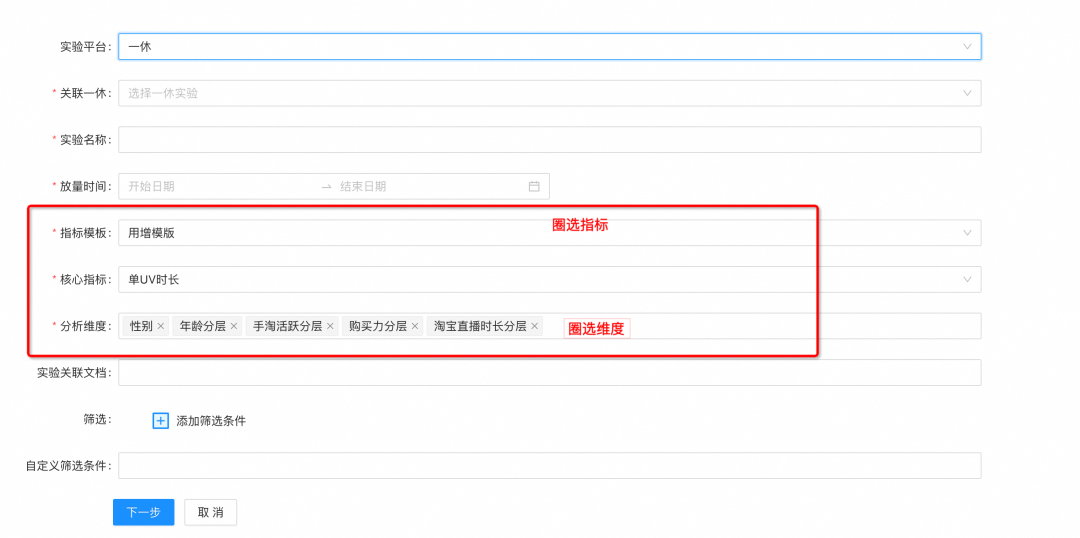
确定需要观察的指标&维度:
在上述案例中,可以发现漏看关键指标、关键维度都可能影响实验结论产出,且实际过程中实验往往需要下钻到关键维度,根据维度项里对实验的差异反应,寻找迭代方向。
▐ 案例七:「实验正确看数」在提单价的实验中,我们发现实验的GMV提升明显,但是观看时长显著降低
案例分析
由于提高了价格带,导致部分低购用户直接选择不看了,而这部分用户本身对GMV的贡献也不大,所以实验依然能够取得明显效果,然而低购群体里的较低年龄段用户他们贡献了较多的观看时长,因此该实验的观看时长也被显著降低。
因此得出一个业务经验:提单价的实验应避免波及(低GMV贡献但高观看时长贡献)的用户。
当前解法
针对不同业务背景,提前确定看数范围(指标+维度),避免经验不足引起的实验观察错误,通常这块由业务方+数据同学共同制定。
判断低响应实验
▐ 案例八:「低响应实验」活动入口做的AB实验,响应度太低无法分析实验数据。

案例分析
当前解法
▐ 定量分析
这块在第一篇文章中已经浓重介绍过,这里不再赘述。简单提及要点:没有置信度支撑的数据叫随机波动,不要当作实验结论。
思考:

相关资料
实验推全最终会回应到业务目标达成,我在这块的推动经验较为薄弱,如何围绕业务目标建立可量化的推全标准,这需要多方的信任基础和强大的组织推力,以后补充。
感谢领导信任,让我有机会在直播业务中完善我对A/B实验的理解;感谢大佬的大力支持,感谢所有合作的产品老师、运营老师、算法老师、工程老师、数据研发老师、数据科学老师的大力支持。

技术线内容技术团队,是承接淘天内容电商最核心的技术力量,团队拥有非常全面的内容技术领域布局,不仅覆盖音视频编解码、流媒体传输、低延时直播等多媒体技术,也包含计算机视觉、自然语言处理、多模态內容理解、AIGC等人工智能领域。
在内容技术领域之外,团队拥有强大的算法、前端、客户端、服务端、测试开发、数据开发、数据科学团队、负责面向亿级消费者提供服务的淘宝直播、淘宝逛逛、点淘等核心业务场域;
面向千万级商家、品牌、机构、达人的内容创作工具、内容运营平台内容商业化解决方案;以及面向淘天集团电商板块各业务线的内容管理、内容总线等基石平台。
简历投递邮箱:[email protected]
本文分享自微信公众号 - 大淘宝技术(AlibabaMTT)。
如有侵权,请联系 [email protected] 删除。
本文参与“OSC源创计划”,欢迎正在阅读的你也加入,一起分享。