
Give everyone 30 seconds to think about what this is?
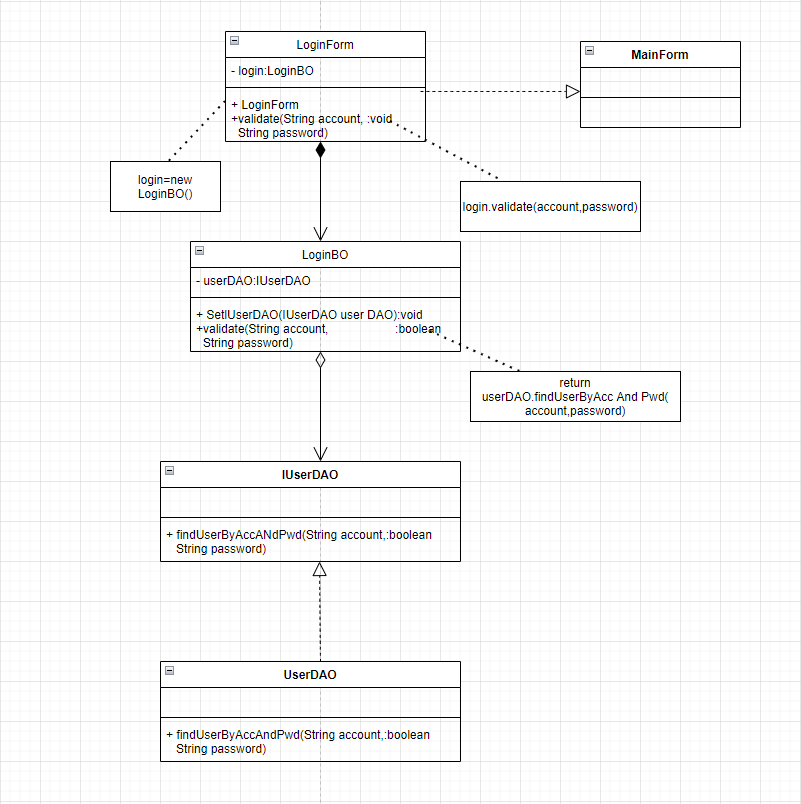
This is the initial class diagram of the login module function of a certain system.
As modern software continues to become more complex, Code Graphs provide testers with an intuitive way to make complex code logic easy to understand. This article will delve into code graphs and demonstrate how visual code graphs can enhance the capabilities of software testers and how to conduct testing through excavated real-life scenarios and practical examples.
1. What is a code diagram?
Code diagram refers to a graphical tool used to represent code structure, relationships between classes, or interactions between code elements. Common types include class diagrams, sequence diagrams, activity diagrams, component diagrams, etc.
The code map consists of the following two parts:
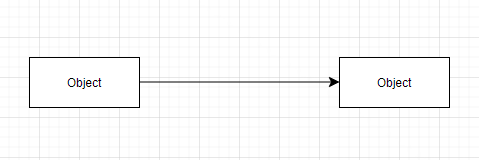
- Nodes ( Nodes ) represent code elements, such as classes, objects, and activities;
- Edges represent relationships between nodes, such as association, inheritance, and dependency .
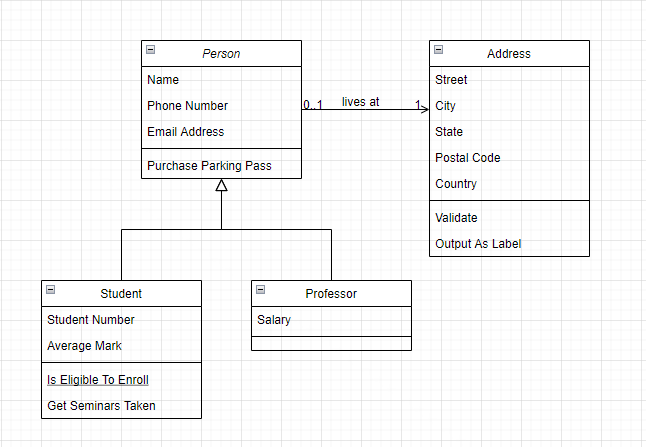
Take the class diagram of a combination relationship as an example:
2. Benefits of code visualization
Code visualization graphically displays code structure and relationships. Team members have many benefits by using code diagrams during the software testing process, such as improving communication and collaboration between each other, increasing efficiency and concentration, etc. This helps software testers understand code logic and relationships more quickly, reducing the time cost of reading and understanding code.
1Improve communication and collaboration
The important role of code diagrams is to help bridge the gap between technical and non-technical people. Testers can easily explain code flow to managers, customers, or members who are unfamiliar with the code.
Stelios Manioudakis, a former Siemens software engineer, took himself as an example to fully illustrate the role of code diagrams in improving communication and collaboration.
In his early days as a software tester, he worked on a project to develop a new fitness tracker app. They analyze sensor data through sleep tracking algorithms to determine sleep stages (light sleep, deep sleep) and generate sleep reports. But in the process of testing the algorithm, they encountered a lot of difficulties, because it is difficult for non-technical people to understand the algorithm logic through code alone.
This is where code diagrams come in handy. They use visual algorithm flow and decision points for different sensor readings and sleep pattern calculations to let product managers and UI designers understand potential scenarios that need to be tested through code diagrams, such as unstable sleep patterns or missing sensor data.
In addition to this, code maps facilitate collaboration with developers. During code reviews, testers and developers can better identify potential differences between the intended logic and the actual implementation by referring to the code map. In the end, the sleep tracking algorithm in the fitness tracking application successfully passed the test, and the code diagram played a major role.
2 Improve efficiency and concentration
Testers can plan, write and execute tests more efficiently through code diagrams, reducing repetitive work, thereby improving test coverage and quality.
Take the news push algorithm as an example. This algorithm makes personalized recommendations to users based on their interests and interactions. Initially, testers need to carefully go through the code line by line, a time-consuming and laborious approach that makes it difficult to identify all potential testing scenarios. But code diagrams display influencing factors such as user preferences, post interactions, and content freshness in an intuitive way. Not only that, code diagrams provide clear decision points and branching paths.
- Hot Topics: Focus on testing scenarios where hot topics are displayed first in the information stream to ensure that users will not miss popular content.
- Personalized recommendations: Prioritize testing of different user profiles with different interests and interactions to verify whether the algorithm accurately recommends relevant content.
- Edge Cases: Potential edge cases such as inactive users or users with limited interaction are highlighted. Testers can design specific test cases to ensure that the algorithm does not fail under these circumstances.
It is obvious that using code diagrams is much faster than inspecting the code line by line. This enables testers to prioritize key areas of the algorithm, ensuring thorough testing and providing users with a more reliable and personalized news feed experience.
3Enhance document maintainability
Documentation can help team members more quickly understand program flow and potential test points after code refactoring or when new team members need to review the code.
For example: the inventory management system of an e-commerce platform was established many years ago. Nowadays, maintenance has become more and more complex, and new functions have become increasingly difficult to implement. During the system adjustment process, faced with complex inventory management logic, the code diagram intuitively displays everything from product addition and update to order processing and inventory level management.
In this way, testers can ensure that the adjusted inventory management system is maintained efficiently, and the role of code diagrams is self-evident.
- Communicate more clearly: Use code diagrams to explain the functionality of the system to new team members. Together with code comments, these diagrams provide a clear and concise overview, making it faster to grasp the system's logic and testing considerations.
- Efficient code review: During code review, referencing code diagrams and code comments can help identify potential issues early. By visualizing the impact of changes on the overall process, teams can ensure that modifications do not have unintended side effects on other parts of the system.
- Future-proof maintenance: As the system evolves and new features are added, code diagrams serve as valuable reference points. Even testers who have not been involved in the project can easily understand the existing logic and potential impact areas, allowing for more efficient and targeted testing efforts.
4. Detect problems early
Code diagrams can reveal issues that might be missed in a plain-text code review, because messier code diagrams indicate more complex code, which is more error-prone.
For example, the hospital's appointment scheduling system introduced a new feature during the update process: allowing patients to reschedule appointments online. After code review and test case design, new features can be put into use if no major problems are found.
However, given the complexity involved in handling specific parts of conflicting appointments, the testers decided to employ code diagrams for further inspection and validation. Code diagrams illustrate potential issues that might be overlooked in a text-only review:
- Multiple decision points: Numerous decision points based on various factors such as existing appointments, doctor availability, and time constraints. This complex branching structure means a higher risk of error since it is difficult to consider all possible scenarios during testing. .
- Hidden logic: The complex nature of diagrams makes it very difficult to visually understand the code logic. This raises concerns about possible hidden conditions or unexpected behavior in the code.
As a result, the testers re-adjusted the new functions based on the code diagram:
- Prioritize testing: Prioritize testing of scenarios involving conflicting dates. Focus on edge cases and combinations that can expose potential errors in complex logic.
- Collaborate with developers: With the help of visual representations, testers discuss discovered complexities with developers. The collaboration resulted in code refactoring efforts that simplified logic and reduced cyclomatic complexity.
Testers use code maps to proactively identify potential issues and work with developers to resolve them. This ensures the integrity and reliability of the hospital appointment scheduling system.
5 Structured programming connections
Code diagrams fit seamlessly into the principles of structured programming (sequence, selection, and repetition). These basic structures map directly to specific graphics patterns, simplifying testing of these common structures.
(1) Simplified test design: Structured programming emphasizes clearly defined structures, such as sequence, selection (if-else) and repetition (loop). Code maps map these structures directly to specific patterns:
- Sequence: A straight line node representing one statement following another statement
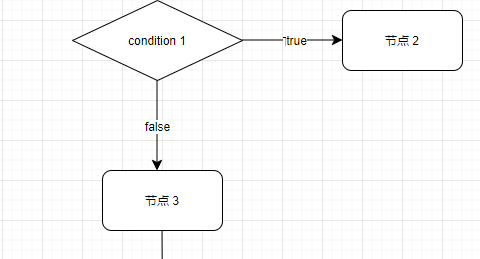
- Selection: a branching structure with a single entry node, a conditional node, and two outgoing edges (one for true and one for false), leading to a separate sequence of statements
- Repeat: A loop pattern with an entry node, a condition node, an edge returning the condition node, and an edge pointing to the loop body (sequence of statements)
(2) Easier visualization of test cases: By identifying these familiar patterns in code diagrams, testers can quickly understand the flow of the program and the corresponding test cases. For example, the loop pattern in the diagram represents the need for test cases to cover various iterations of the loop, including boundary conditions and expected behavior.
6 More on complexity measurement
Cycle number is a measure based on the complexity of the code graph that helps evaluate the difficulty of testing a program. The higher the complexity (the more paths), the more thorough the testing will be. But let’s dive into more details.
- Loop Count: This metric is derived from the structure of the code graph and is used to estimate the number of independent execution paths in a program. The higher the loop count, the higher the complexity, usually due to factors such as nested loops, multiple decision points, or GOTO statements.
- Smart test planning: Cycle numbers serve as a guide for testers, indicating the amount of effort required for comprehensive testing. A program with a higher loop count requires more test cases to cover all potential execution paths than a program with a lower loop count. This helps testers prioritize their work and ensure comprehensive coverage of complex sections.
Here's a quick example, consider a simple program with two consecutive if-else statements:
if condition1:
  # statements for if condition1 is true
else:
  if condition2:
    # statements for if condition2 is true
  else:
    # statements for both conditions false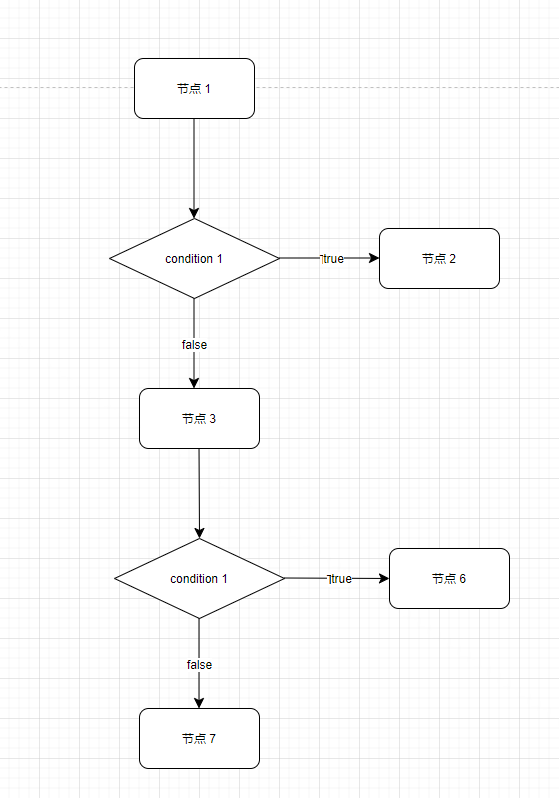
node:
- Node 1 : The starting point of the program, representing the beginning of code execution.
- Node 2 : Decision node condition1 . This node evaluates the condition and determines the execution flow based on the result (true or false).
- Node 3 : The statement block condition1 is executed if it is true . This node represents all code within the "if" block of condition1 .
- Node 4 : The "else" node associated with condition1 . This node represents the alternative path if condition2 is not checked (i.e. condition1 is false).
- Node 5 : Decision node of condition2 . This node evaluates the condition and decides the execution flow based on the result (true or false).
- Node 6 : The statement block executed when condition2 is true. This node represents all the code in the "if" code block of condition2 .
- Node 7 : The "else" node associated with condition2 - this node represents the end of the program and represents the code that is executed if both condition1 and condition2 are false.
side:
- Edge 1 : Connects node 1 and node 2 , representing the initial flow from the starting point to the first decision point
- Edge 2 (true): condition1 connects node 2 and node 3 , indicating the process to be executed if it is true.
- Edge 3 (false): condition1 connects node 2 and node 4 , indicating that if it is false, the alternative flow will be adopted
- Edge 4 : Connects node 4 and node 5 , indicating the flow from the "else" block to the second decision point of condition1
- Edge 5 (true): condition2 connects node 5 and node 6 , indicating the process to be executed if true
- Edge 6 (false): condition2 connects node 5 and node 7 , indicating the endpoint when it is false
The corresponding code graph will have a branching structure with three decision points and multiple execution paths. The number of cycles of this graph is 4 (nodes - edges + 2 ). This indicates that the logic may be more complex and require more test cases than a program with a simpler structure.
By understanding these benefits, software testers can leverage code diagrams to effectively navigate program logic, design effective test cases, and help deliver high-quality software.
Let us explain in detail how to derive the circle number 4 .
- Cyclomatic complexity tells us how many independent paths there are in a program. The more paths there are, the more complex the test is.
- In this code we have two decisions (check condition1 and condition2 ). Each decision creates a potential fork in the path (true or false).
- However, since the else block condition1 points directly to the decision condition2 , there is no real branch there. It's like a one-way street leading to another decision point.
- Therefore, we only count independent decision points: initial point , condition1 (true or false) , condition2 (true or false).
Since we have 3 decision points, but adding 1 because of the starting point is a common way of calculating cyclomatic complexity, the final number is 3 + 1 = 4 .
remember:
- Higher cyclomatic complexity doesn't necessarily mean the code is bad, but it indicates that more testing scenarios may need to be considered.
- 由于复杂度为 4,此代码片段并不太复杂,但随着判定数量和条件嵌套的增加,圈复杂度和测试工作量会显著增加。
3. Limitations of code diagrams
Although code diagrams have the advantages of improving communication and collaboration, increasing efficiency and focus, testers also need to pay attention to the following things:
1 cannot execute element
- Ignore comments and declarations: Code diagrams focus primarily on the flow of control within a program, represented by executable statements. Non-executable elements such as comments and data declarations are usually ignored because they do not directly affect code execution.
- Potential for Misunderstanding: While omitting these elements can simplify the diagram, it can cause some misunderstandings. Testers need to be aware of these ignored elements and make sure they are taken into account during testing to avoid overlooking potential problems related to data initialization, logic comments, or other non-executable code sections.
2 Distinguish path feasibility
- Challenges in identifying meaningful paths: Not all paths in a code graph represent valid or meaningful sequences of execution. Certain paths are technically feasible (topologically feasible) depending on the graph structure, but are illogical or meaningless (semantically unfeasible) in the context of program logic.
- Increased testing effort: Identifying and prioritizing viable testing paths can be challenging and require additional effort from testers. They need to analyze program logic and context to distinguish valid from invalid paths, which may result in additional test case design and execution time.
3 Alleviating these limitations
- Combine with other testing techniques: Code diagrams work best when combined with other testing techniques such as code review or data flow analysis. These techniques can help identify non-executable elements and their potential impact, while also helping to understand the logic of a program to better assess the feasibility of a path.
- Focus on critical paths: Testers can prioritize testing high-risk or critical paths in the code graph. This involves considering factors such as loop conditions, expected user input, and potential error scenarios to determine the path that will have the greatest impact on the test.
By understanding and working around these limitations, testers can effectively utilize code graphs. Comprehensive and efficient testing can be conducted while acknowledging its inherent limitations and the need to combine it with other testing methods.
4. Write at the end
The enterprise IM software independently developed by the ZenTao software team integrates the open source application draw.oi , which organically combines chat and collaboration. All code diagrams in this article are completed using this function. By utilizing code diagrams, software testers can gain a deeper understanding of program logic. They can design more effective test cases and contribute to delivering high-quality software.
We have to admit that as the software landscape continues to evolve, code diagrams will continue to be an important tool in ensuring the reliability and robustness of applications.
*Reference: Code Graphs: A Guide for Testers by Stelios Maniooudakis
RustDesk suspended domestic service Taobao (taobao.com) due to rampant fraud, restarted web version optimization work, Apple released M4 chip, high school students created their own open source programming language as a coming-of-age ceremony - Netizens commented: Relying on the defense, Yunfeng resigned from Alibaba, and plans to produce in the future Visual Studio Code 1.89, the destination for independent game programmers on the Windows platform, is officially announced by Huawei. Yu Chengdong’s job adjustment was nailed to the “FFmpeg Pillar of Shame” 15 years ago, but today he has to thank us - Tencent QQ Video avenges its previous shame? The open source mirror station of Huazhong University of Science and Technology is officially open to external network access