原文链接https://blog.csdn.net/helunqu2017/article/details/78641290,感谢作者辛勤付出,仅作笔记使用,侵删
1.图例legend基础语法及用法
legend语法参数如下: matplotlib.pyplot.legend(*args, **kwargs)
注:*代表接受一个元组,**代表接受一个词典
|
Keyword
|
Description
|
|
loc
|
Location code string, or tuple (see below).图例所有figure位置
|
|
prop
|
the font property字体参数
|
|
fontsize
|
the font size (used only if prop is not specified)
|
|
markerscale
|
the relative size of legend markers vs. original
图例标记与原始标记的相对大小
|
|
markerfirst
|
If True (default), marker is to left of the label.
如果为True,则图例标记位于图例标签的左侧
|
|
numpoints
|
the number of points in the legend for line
为线条图图例条目创建的标记点数
|
|
scatterpoints
|
the number of points in the legend for scatter plot
为散点图图例条目创建的标记点数
|
|
scatteryoffsets
|
a list of yoffsets for scatter symbols in legend
为散点图图例条目创建的标记的垂直偏移量
|
|
frameon
|
If True, draw the legend on a patch (frame).
控制是否应在图例周围绘制框架
|
|
fancybox
|
If True, draw the frame with a round fancybox.
控制是否应在构成图例背景的FancyBboxPatch周围启用圆边
|
|
shadow
|
If True, draw a shadow behind legend.
控制是否在图例后面画一个阴影
|
|
framealpha
|
Transparency of the frame.
控制图例框架的 Alpha 透明度
|
|
edgecolor
|
Frame edgecolor.
|
|
facecolor
|
Frame facecolor.
|
|
ncol
|
number of columns 设置图例分为n列展示
|
|
borderpad
|
the fractional whitespace inside the legend border
图例边框的内边距
|
|
labelspacing
|
the vertical space between the legend entries
图例条目之间的垂直间距
|
|
handlelength
|
the length of the legend handles
图例句柄的长度
|
|
handleheight
|
the height of the legend handles
图例句柄的高度
|
|
handletextpad
|
the pad between the legend handle and text
图例句柄和文本之间的间距
|
|
borderaxespad
|
the pad between the axes and legend border
轴与图例边框之间的距离
|
|
columnspacing
|
the spacing between columns 列间距
|
|
title
|
the legend title
|
|
bbox_to_anchor
|
the bbox that the legend will be anchored.指定图例在轴的位置
|
|
bbox_transform
|
the transform for the bbox. transAxes if None.
|
(1)设置图例位置
使用loc参数
plt.legend(loc='lower left')
|
0: ‘best'
1: ‘upper right'
2: ‘upper left'
3: ‘lower left'
|
4: ‘lower right'
5: ‘right'
6: ‘center left'
|
7: ‘center right'
8: ‘lower center'
9: ‘upper center'
10: ‘center'
|
(2)设置图例字体
#设置字体大小
fontsize : int or float or {‘xx-small’, ‘x-small’, ‘small’, ‘medium’, ‘large’, ‘x-large’, ‘xx-large’}
(3)设置图例边框及背景
plt.legend(loc='best',frameon=False) #去掉图例边框
plt.legend(loc='best',edgecolor='blue') #设置图例边框颜色
plt.legend(loc='best',facecolor='blue') #设置图例背景颜色,若无边框,参数无效
(4)设置图例标题
plt.legend(loc='best',title='figure 1 legend') #去掉图例边框
(1)获取并设置legend图例
plt.legend(loc=0, numpoints=1)
leg = plt.gca().get_legend() #或leg=ax.get_legend()
ltext = leg.get_texts()
plt.setp(ltext, fontsize=12,fontweight='bold')
(2)设置图例
legend = ax.legend((rectsTest1, rectsTest2, rectsTest3), ('test1', 'test2', 'test3'))
legend = ax.legend(loc='upper center', shadow=True, fontsize='x-large')
legend.get_frame().set_facecolor('red') #设置图例legend背景为红色
frame = legend.get_frame()
frame.set_alpha(1)
frame.set_facecolor('none') #设置图例legend背景透明
(3)移除图例
ax1.legend_.remove() ##移除子图ax1中的图例
ax2.legend_.remove() ##移除子图ax2中的图例
ax3.legend_.remove() ##移除子图ax3中的图例
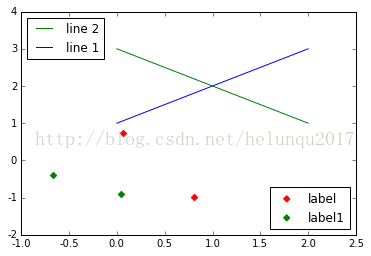
3.案例:设置图例legend到图形边界外