简介
Graphviz 是 AT&T 实验室开发的一个开源软件,它以一种文本语言去描述图(graph),然后自动排布节点和边去生成图片。它已有近 30 年历史。
UML(unified modeling language,统一建模语言)是一种常用的面向对象设计的方法。其中最常用的是类图(class diagram),用于表示类的构成以及类之间的关系。
利用 Graphviz 去生成 UML 类图有几个好处:
- 用文本表示图,容易更新,容易做版本管理。
- 能自动排布节点位置,在大型复杂的图特别方便。
- 统一文档风格。
实际上,文档生成工具Doxygen 也是采用 Graphviz 生成类图的。不过,我们在软件设计中,经常以类图表示系统中某个部分,并且按需展示某些重点,而不是简单地全部列出,所以还是需要手工去描述我们想要画什么,表示我们的软件设计。
使用 Graphviz dot
首先,下载 Graphviz 安装包。
- macOS 用户可以 brew install graphviz。
- linux可以yum install graphviz。
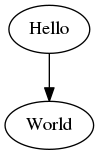
建立一个测试源文件 hello.dot(DOT语言为 Graphviz 的图形描述语言):
digraph {
    Hello -> World
}
在命令行执行就可以生成文件:
dot -Tpng hello.dot -o hello.png
结果如下:
作为程序员,我们可以用常用的 GNU make 去做这个生成,以下的 makefile 也展示生成 PDF 矢量格式:
DOTFILES = $(basename $(wildcard *.dot))

all: \
    $(addsuffix .png, $(DOTFILES)) \
    $(addsuffix .pdf, $(DOTFILES))

%.png: %.dot
    dot $< -Tpng -o $@

%.pdf: %.dot
    dot $< -Tpdf -o $@
类图
UML 类图(class diagram)是最常见的图,用于表示系统的静态结构。UML 中类是以矩形表示。我们可以在 dot 文件中预设节点的形状,并且设置一些如字体等属性:
digraph {
    node [shape=box, fontname="Inconsolata, Consolas", fontsize=10, penwidth=0.5]

    Foo
    Bar
}
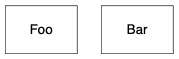
稍后我们再谈如何加入类的成员。
继承
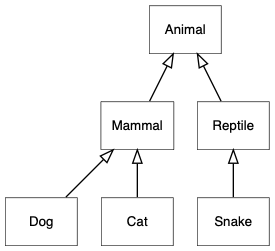
继承(inheritance)是类之间很重要的关系,在 UML 中又称其为泛化(generalization)关系,以空心箭头表示派生类指向基类。在 DOT 语言中,可以设置边的箭头形状,不过要注意,通常我们会把基类放在上面,因此我通常会这样设置:
digraph {
    node [shape=box, fontname="Inconsolata, Consolas", fontsize=10, penwidth=0.5]

    Animal, Mammal, Reptile, Dog, Cat, Snake

    /* inheritance */
    {
        edge [arrowtail=onormal, dir=back]

        Animal -> { Mammal, Reptile }
        Mammal -> { Dog, Cat}
        Reptile -> Snake
    }
}
关联
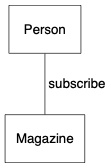
UML 中的关联(association)描述两个类的关系,以类之间的实线表示。例如人和杂志的关系是订阅:
digraph {
    node [shape=box, fontname="Inconsolata, Consolas", fontsize=10, penwidth=0.5]

    Person, Magazine

    /* Association */
    {
        edge [dir=none]
        Person -> Magazine [label=" subscribe"]
    }
}
我们经常会表示关联之间的多重性(multiplicity),例如 Person 类的实例最多可订阅 5 本杂志,而每本杂志可被任意数目的人订阅:
digraph {
    node [shape=box, fontname="Inconsolata, Consolas", fontsize=10, penwidth=0.5]
    edge [fontname="Inconsolata, Consolas", fontsize=10, penwidth=0.5]

    Person, Magazine

    /* Association with multiplicity */
    {
        edge [dir=none]
        Person -> Magazine [label=" subscribe", headlabel="0..10", taillabel="* "]
    }
}
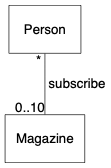
注意,上面的例子在 label、headlabel、taillabel 加入空格避免它们太贴近连线(这不完美)。
关联可以是单向或双向的,以线形箭头表示,无箭头也表示双向关联。以下展示单向关联,面试官知道他对应的候选人,但候选人不知道面试官:
digraph {
    node [shape=box, fontname="Inconsolata, Consolas", fontsize=10, penwidth=0.5]
    edge [fontname="Inconsolata, Consolas", fontsize=10, penwidth=0.5]

    Interviewer, Candidate

    /* Unidirection association */
    {
        Interviewer -> Candidate [arrowhead=vee]
    }
}
聚合
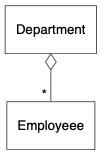
聚合(aggregation)是一种特殊的关系,是一种弱的包含关系,包含方以空心菱形表示。例如,一个部门含有一些员工:
digraph {
    node [shape=box, fontname="Inconsolata, Consolas", fontsize=10, penwidth=0.5]
    edge [fontname="Inconsolata, Consolas", fontsize=10, penwidth=0.5]

    Department, Employeee

    /* Aggregation */
    {
        edge [dir=back, arrowtail=odiamond, headlabel="* "]
        Department -> Employeee
    }
}
组成
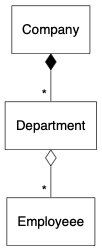
组成(composition)是更强的包含关系,说明一个类的实例是另一个类的组成部分,它们有一致的生命周期,组成方以实心菱形表示。例如,一家公司由多个部门组成,若果公司结业,部门也不存在了:
digraph {
    node [shape=box, fontname="Inconsolata, Consolas", fontsize=10, penwidth=0.5]
    edge [fontname="Inconsolata, Consolas", fontsize=10, penwidth=0.5]

    Company, Department, Employeee

    /* Composition */
    {
        edge [dir=back, arrowtail=diamond, headlabel="* "]
        Company -> Department
    }

    /* Aggregation */
    {
        edge [dir=back, arrowtail=odiamond, headlabel="* "]
        Department -> Employeee
    }
}
依赖
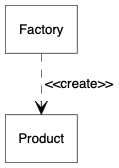
依赖(depedency)关系说明一个类会使用到另一个类,例如表示以一个类作为成员方法的参数或返回值。UML 中采用线形箭头和虚线表示。以下的例子表示工厂创建产品,常见于各种工厂模式,工厂不拥有产品。
digraph {
    node [shape=box, fontname="Inconsolata, Consolas", fontsize=10, penwidth=0.5]
    edge [fontname="Inconsolata, Consolas", fontsize=10, penwidth=0.5]

    Factory, Product

    /* Dependency */
    {
        edge [arrowhead=vee, style=dashed]
        Factory -> Product [label=" <<create>>"]
    }
}
类成员
类除了名字,也可以展示其成员。成员包括属性(attribute)和方法(method)。
每个成员的可见性(visibility)以一个前置符号表示:
- + 公有(public)
- - 私有(private)
- # 保护(protected)
- ~ 包(package)
如果成员为静态(static)的,则加下划线。
属性的格式为:
<visibility> <attribute name> : <type>
方法的格式为:
<visibility> <method name> (<param1 name> : <param1 type>, ...) : <return type>
Graphviz 可使用 record shape 或 HTML table 来分隔类名字、属性和方法,例如以下的 C++ 类:
class Account {
public:
    void Deposite(int amount);
    void Withdraw(int amount);
    int GetAmount();
protected:
    int balance;
private:
    string owner;
};
用 record shape 的话可写作:
digraph {
    node [shape=record, fontname="Inconsolata, Consolas", fontsize=10, penwidth=0.5]

    Account [label="{
Account
|
# balance : int\l
- owner : string\l
|
+ Deposite(amount : int)\l
+ Withdraw(amount : int)\l
+ GetBalance() : int\l
}"]

}
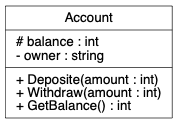
当中,\l 是代表该行向左对齐并换行。
如需更多控制,则可使用 HTML table,但就会更冗长:
digraph {
    node [shape=plaintext, fontname="Inconsolata, Consolas", fontsize=10, penwidth=0.5]

    Account [label=<
<table border="0" cellborder="1" cellspacing="0">
<tr><td align="left" balign="left">
# balance : int<br/>
- owner : string<br/>
</td></tr>
<tr><td>Account</td></tr>
<tr><td align="left" balign="left">
+ Deposite(amount : int)<br/>
+ Withdraw(amount : int)<br/>
+ GetBalance() : int<br/>
</td></tr>
</table>
>]

}
使用 HTML table 可加入 (下划线)、 (斜体)等字体控制,但只在一些渲染器中有效。如需表示静态或抽像,可利用 stereotype <<abstract>>、<<static>> 等说明。
再重申一次,类图不必要展示所有细节,可按想表达的意思仅加入部分成员,每个方法也可忽略一些参数细节。
包
在比较大的系统里,类通常会用包(package)的方式来组织。Graphviz 不能简单还完 UML 包的图形,但可以使用 subgraph cluster 功能去近似地表示类属于那个包。
digraph {
    graph [fontname="Inconsolata, Consolas", fontsize=10, penwidth=0.5,
        labeljust=left]
    node [shape=box, fontname="Inconsolata, Consolas", fontsize=10, penwidth=0.5]
    edge [fontname="Inconsolata, Consolas", fontsize=10, penwidth=0.5]

    subgraph clusterView {
        label="View"
        AccountView, CustomerView
    }

    subgraph clusterModel {
        label="Model"
        Account, Customer
    }

    /* Unidirecitonal association */
    {
        edge [arrowhead=vee]
        AccountView -> Account
        CustomerView -> Customer
    }
}
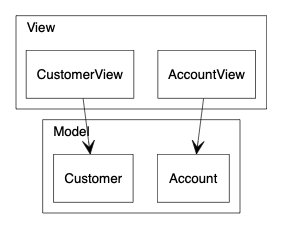
注意,subgraph 的名字必须以 cluster 为前缀。
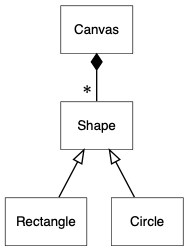
排布技巧
自动排布故然很方便,但有时候我们想做出一些修改。例如,dot 描述的是有向图,从来源节点指向目标节点时,目标节点就会成为下一级,预设设置下,节点会垂直排列,如以下例子:
digraph {
    node [shape=box, fontname="Inconsolata, Consolas", fontsize=10, penwidth=0.5]

    Canvas, Shape, Rectangle, Circle

    /* Inheritance */
    {
        edge [arrowtail=onormal, dir=back]
        Shape -> { Rectangle, Circle }
    }

    /* Composition */
    {
        edge [dir=back, arrowtail=diamond, headlabel="* "]
        Canvas -> Shape
    }
}
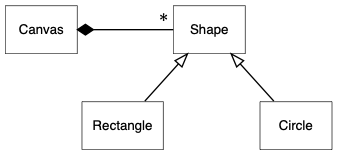
但有时候我们想作一些改动,例如继承沿用这种方式,但关联时则以水平。我们可以使用 rank=same 去设置一组节点为同一级,节点之间的距离可整体设置 nodesep 属性:
digraph {
    graph [nodesep=1]
    node [shape=box, fontname="Inconsolata, Consolas", fontsize=10, penwidth=0.5]

    {
        rank=same
        Canvas, Shape
    }

    Rectangle, Circle

    /* inheritance */
    {
        edge [arrowtail=onormal, dir=back]
        Shape -> { Rectangle, Circle }
    }

    /* composition */
    {
        edge [dir=back, arrowtail=diamond, headlabel="* "]
        Canvas -> Shape
    }
}
颜色
UML 图也不一定是黑白的。做软件设计时可以加入颜色去加入一些意思,例如不同包的类可设置为不同颜色。挑选颜色是一个头痛的问题,可以采用 Graphviz 的配色方案(color scheme)功能。例如用 colorscheme=spectral7 设置 7 个光谱色配色方案,然后我们可以用 fillcolor=1 至 7 去填充节点形状:
digraph {
    graph [fontname="Inconsolata, Consolas", fontsize=10, penwidth=0.5, labeljust=left]
    node [shape=box, fontname="Inconsolata, Consolas", fontsize=10, penwidth=0.5,
        style=filled, colorscheme=spectral7]
    edge [fontname="Inconsolata, Consolas", fontsize=10, penwidth=0.5]

    subgraph clusterView {
        label="View"
        node [fillcolor=4]
        AccountView, CustomerView
    }

    subgraph clusterModel {
        label="Model"
        node [fillcolor=6]
        Account, Customer
    }

    /* Unidirecitonal association */
    {
        edge [arrowhead=vee]
        AccountView -> Account
        CustomerView -> Customer
    }
}

https://graphviz.gitlab.io/_pages/doc/info/attrs.html
