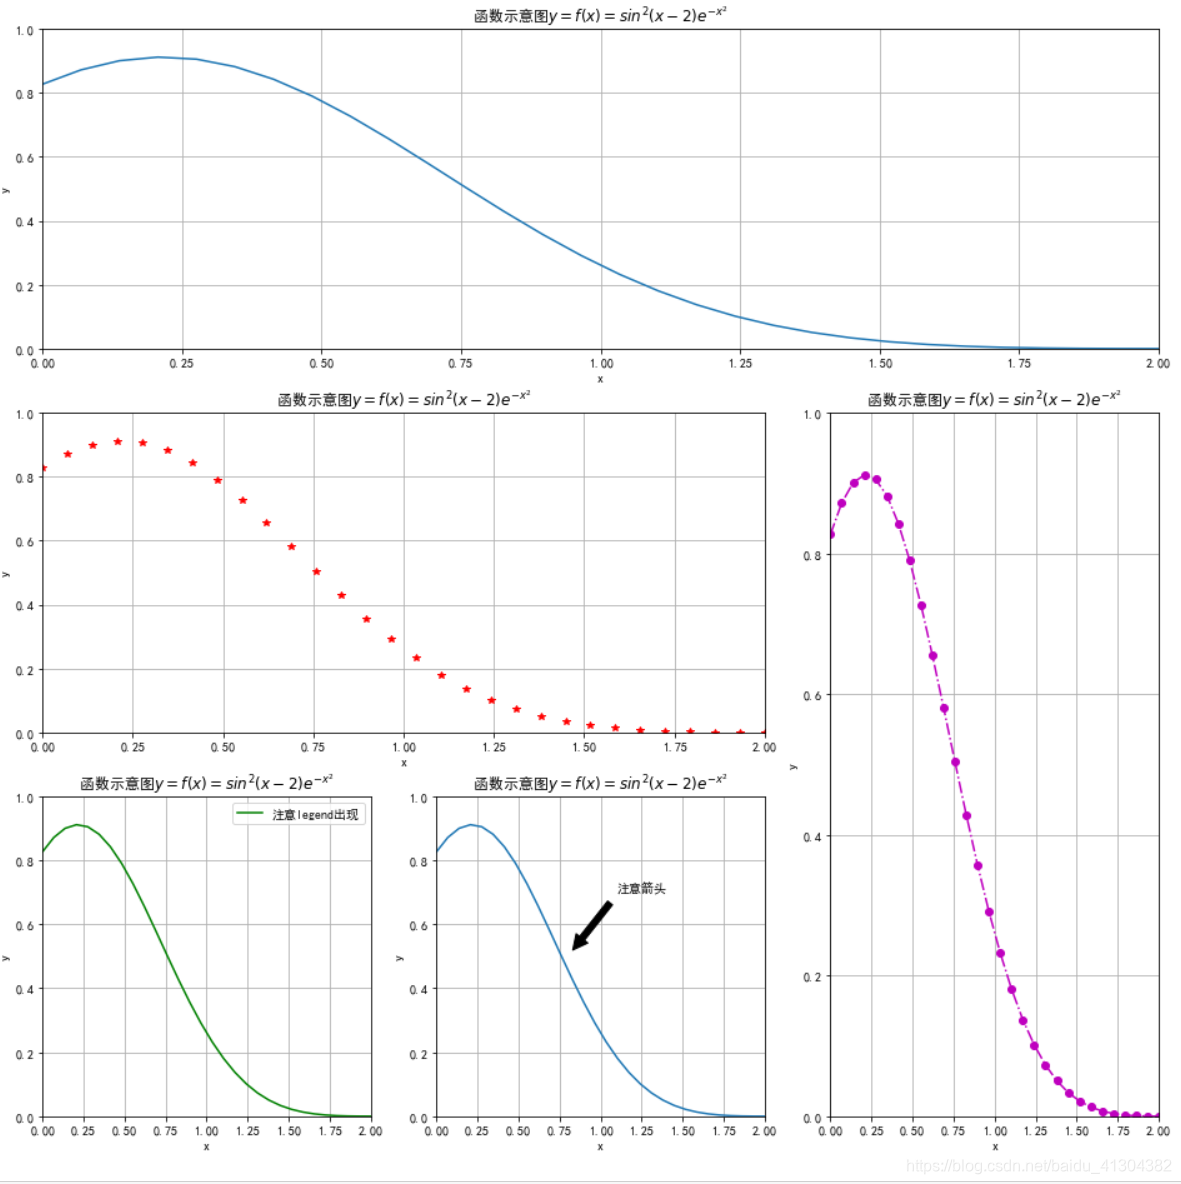
绘制图形要求:
在x的取值范围[0, 2]之间绘制函数:

绘制5副图
'''
plt.subplot2grid(GridSpec, CurSpec, colspan=1, rowspan=1)
说明:设定网格,选中网格,确定选中行列区域数量,编号从0开始
plt.subplot2grid((3,3),(1,0),colspan=2)

plt.annotate(s, xy=arrow_crd, xytext=text_crd, arrowprops=dict)
'''
x=np.linspace(0,2,30)
y=np.power(np.sin(x-2),2)*np.power(np.e,-1*np.power(x,2))

plt.figure(figsize=(16,16))

ax1=plt.subplot2grid((3,3),(0,0),colspan=3)
ax1.plot(x,y)
ax1.set_title(r'函数示意图$y=f(x)=sin^2(x-2)e^{-x^2}$')
ax1.set_xlabel("x")
ax1.set_ylabel("y")
ax1.axis([0,2,0,1]) #设置坐标范围 x y轴
ax1.grid(True)  #设置网格线

ax2=plt.subplot2grid((3,3),(1,0),colspan=2)
ax2.plot(x,y,'r*')
ax2.set_title(r'函数示意图$y=f(x)=sin^2(x-2)e^{-x^2}$')
ax2.set_xlabel("x")
ax2.set_ylabel("y")
ax2.axis([0,2,0,1]) #设置坐标范围 x y轴
ax2.grid(True)  #设置网格线

ax3=plt.subplot2grid((3,3),(1,2),rowspan=2)
ax3.plot(x,y,'m-.o')
ax3.set_title(r'函数示意图$y=f(x)=sin^2(x-2)e^{-x^2}$')
ax3.set_xlabel("x")
ax3.set_ylabel("y")
ax3.axis([0,2,0,1]) #设置坐标范围 x y轴
ax3.grid(True)  #设置网格线

ax4=plt.subplot2grid((3,3),(2,0),rowspan=1)
ax4.plot(x,y,'g',label="注意legend出现")
ax4.set_title(r'函数示意图$y=f(x)=sin^2(x-2)e^{-x^2}$')
ax4.set_xlabel("x")
ax4.set_ylabel("y")
ax4.legend(loc="upper right")#设置图例位置
ax4.axis([0,2,0,1]) #设置坐标范围 x y轴
ax4.grid(True)  #设置网格线

ax5=plt.subplot2grid((3,3),(2,1),rowspan=1)
ax5.plot(x,y)
ax5.set_title(r'函数示意图$y=f(x)=sin^2(x-2)e^{-x^2}$')
ax5.set_xlabel("x")
ax5.set_ylabel("y")
ax5.annotate(r'注意箭头',xy=(0.8,0.5),xytext=(1.1,0.7),
             arrowprops=dict(facecolor='black',shrink=0.1,width=5))#设置箭头
ax5.axis([0,2,0,1]) #设置坐标范围 x y轴
ax5.grid(True)  #设置网格线

plt.show()
解决负号无法显示:
plt.rcParams['axes.unicode_minus']=False # 正常显示负号
