@本文来源于公众号:csdn2299,喜欢可以关注公众号 程序员学府
这篇文章主要介绍了Python matplotlib以日期为x轴作图代码实例,文中通过示例代码介绍的非常详细,对大家的学习或者工作具有一定的参考学习价值,需要的朋友可以参考下
效果图如下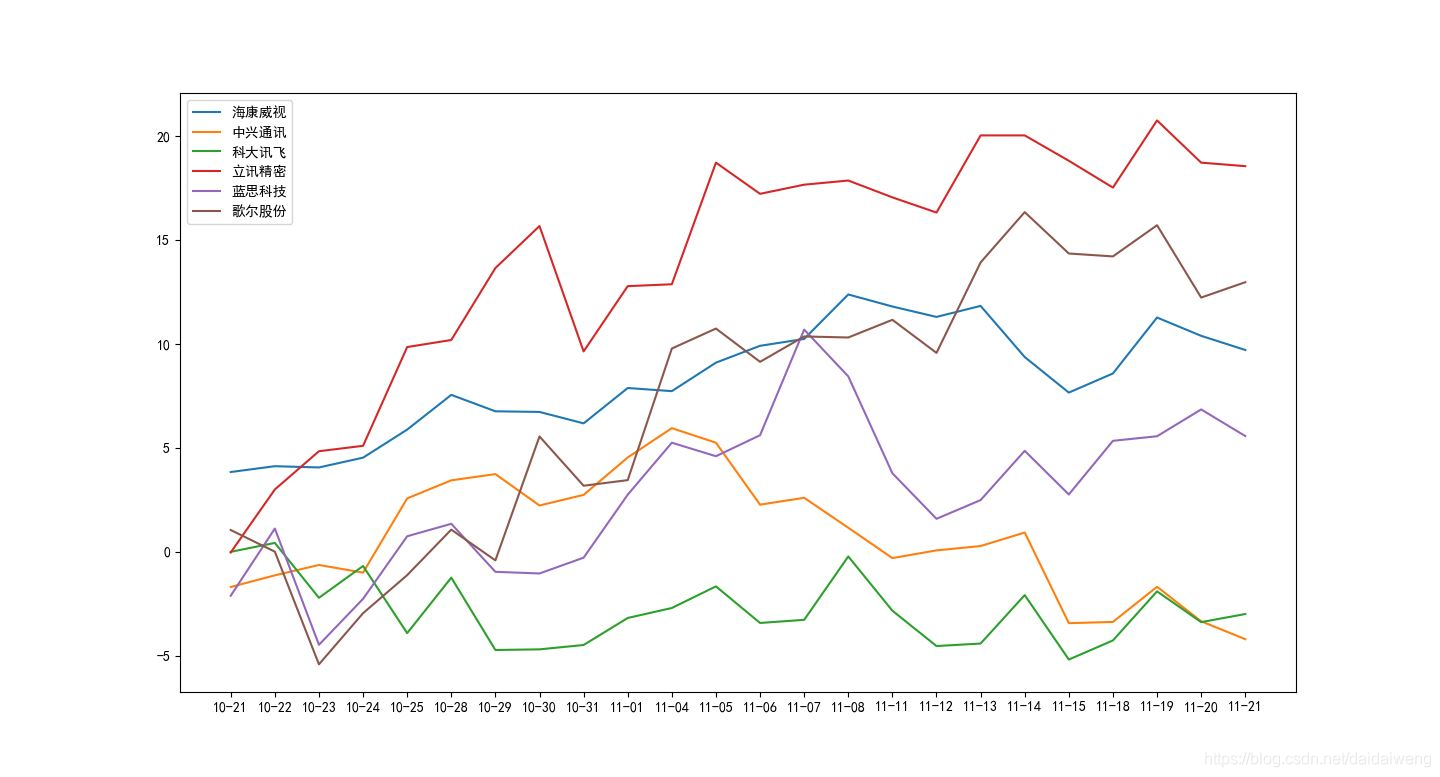
代码如下
from datetime import datetime, date, timedelta
import matplotlib.pyplot as plt
import tushare as ts

plt.rcParams['font.sans-serif'] = ['SimHei'] #显示中文
plt.rcParams['axes.unicode_minus']=False #用来正常显示负号


def get_riqi():
  count = 30
  i = 0
  today = date.today() #今天日期
  riqi_list=[]
  riqi_list.append(str(today))
  while(i<=count):
    i+=1
    riqi_list.append(str((today + timedelta(days=-i))))
  return riqi_list


def count(Data):
  data_list = []
  sum_list = []
  for data in Data:
    sum = 0
    list = []
    for jiage in data:
      sum+=jiage
      list.append(jiage)
    sum_list.append(round(sum,2))
    data_list.append(list)
  return sum_list,data_list

def get_juedui(Data):
  sum = 0
  data = []
  for i in Data[::-1]:
    sum += i
    data.append(sum)
  return data
technology = {
  '海康威视':'002415',
  '中兴通讯':'000063',
  '科大讯飞':'002230',
  '立讯精密':'002475',
  '蓝思科技':'300433',
  '歌尔股份':'002241'
}
store = [technology]
technology = []
def get_data(store,riqi_list):
  count = 0
  for Stock_pool in store:
    count +=1
    for stock in Stock_pool.values():
      data = ts.get_hist_data(stock,start=riqi_list[-1])
      if (count == 1):
        technology.append(data.loc[:, 'p_change'])
riqi_list = get_riqi()
get_data(store,riqi_list)
riqi_list = technology[0].index
rili = []
for riqi in riqi_list:
  rili.append(riqi[5:])
sum2,data2 = count(technology)
riqi_list = [datetime.strptime(d, '%m-%d').date() for d in rili]
count = 0
for i in data2:
  count+=1
  data = get_juedui(i)
  if(count==1):
   plt.plot(rili[::-1], data,label = '海康威视' )
  if(count==2):
   plt.plot(rili[::-1], data,label = '中兴通讯' )
  if(count==3):
   plt.plot(rili[::-1], data,label = '科大讯飞' )
  if(count==4):
   plt.plot(rili[::-1], data,label = '立讯精密' )
  if (count == 5):
   plt.plot(rili[::-1], data, label='蓝思科技')
  if (count == 6):
   plt.plot(rili[::-1], data, label='歌尔股份')
plt.legend()
plt.show()
非常感谢你的阅读
大学的时候选择了自学python,工作了发现吃了计算机基础不好的亏,学历不行这是没办法的事,只能后天弥补,于是在编码之外开启了自己的逆袭之路,不断的学习python核心知识,深入的研习计算机基础知识,整理好了,我放在我们的微信公众号《程序员学府》,如果你也不甘平庸,那就与我一起在编码之外,不断成长吧!
其实这里不仅有技术,更有那些技术之外的东西,比如,如何做一个精致的程序员,而不是“屌丝”,程序员本身就是高贵的一种存在啊,难道不是吗?[点击加入]
想做你自己想成为高尚人,加油!
