- 学习kernel 调试方法
1.内核转储
内核转储(coredump)保存了进程某一时刻的运行状态,它在进程发生问题时产生,此时只要有程序的可执行文件和 coredump 即可对其进行调试,了解产生 coredump 那一刻进程的状态,从而发现问题点。通常情况下coredmp包含了程序运行时的内存,寄存器状态,堆栈指针,内存管理信息等,在设置妥当的情况下,该coredump文件在程序出错时自动生成。
1.1.core操作
- 阻止系统生成core文件:
ulimit -c 0
- 检查生成core文件的选项是否打开:
[john@localhost ~]$ ulimit -c
0
//-c 表示内核转储文件的大小限制,如果显示为零,则未打开。
- 打开core转储文件:
ulimit -c 1073741824 #改为1G
ulimit -c unlimited #改为无限制
- 使设置永久生效的办法:
上面所述方法,只是在当前shell中生效,重启后丢失。永久生效的办法是在profile中添加:
#vi /etc/profile
ulimit -c 1073741824 #注意,若将产生的转储文件大小大于该数字时,将不会产生转储文件
- 指定内核转储的文件名和目录
缺省情况下,内核在coredump时所产生的core文件与该程序在相同的目录中,并且文件名固定为core。这时,如果有多个程序产生core文件,或者同一个程序多次崩溃,就会重复覆盖同一个core文件。可以通过修改kernel的参数,指定内核转储所生成的core文件的路径和文件名。在/etc/sysctl.conf中,设置sysctl变量kernel.core_pattern的值。
#vi /etc/sysctl.conf
kernel.core_pattern = /var/core/core_%e_%p #指定生成coredump文件的路径和文件名
kernel.core_uses_pid = 0
需要说明的是,如果/proc/sys/kernel/core_uses_pid的内容被配置成1,即使core_pattern中没有设置%p,最后生成的core dump文件名仍会加上进程ID。其中,%e, %p分别表示:
%c 转储文件的大小上限
%e 所dump的文件名
%g 所dump的进程的实际组ID
%h 主机名
%p 所dump的进程PID
%s 导致本次coredump的信号
%t 转储时刻(由1970年1月1日起计的秒数)
%u 所dump进程的实际用户ID
可以使用以下命令,使修改结果马上生效。
sysctl –p /etc/sysctl.conf
- 使用用户程序自动压缩转储文件
为了减轻磁盘的压力通常对 coredump 进行压缩,可在 kernel.core_pattern 中使用管道符来启动用户程序来实现这一点。
$ echo “|/usr/local/sbin/core_helper %t %e %p” > /proc/sys/kernel/core_pattern
其中 core_helper 即为我们的用户程序如下:
#!/bin/sh
exec gizp -> /var/core/$1-$2-$3.core.gz
1.2.使用core dump进行调试
#include <stdio.h>
int main(void)
{
    int *a = NULL;
    *a = 0x1;

    return 0;
}
使用gcc -g a.c编译生成可执行文件a.out,运行就会显示:Segmentation fault(core dump),这表示在当前目录下, 已经生成了a.out对应的内核转储文件。
使用以下方式启动GDB调试:
#gdb -c ./*.core ./a.out
GNU gdb (GDB) 7.1-Ubuntu
…
Core was generated by ‘./a.out’.
Program terminated with signal 11, Segmentation fault.
#0 0x00000000004004dc in main() at a.c:6
6 *a =0x1;
a.c的第6行收到了11号信号。用GDB的list命令可以查看附近的源代码。
2.Oops
An “Oops” is what the kernel throws at us when it finds something faulty, or an exception, in the kernel code. It’s somewhat like the segfaults of user-space. An Oops dumps its message on the console; it contains the processor status and the CPU registers of when the fault occurred. The offending process that triggered this Oops gets killed without releasing locks or cleaning up structures. The system may not even resume its normal operations sometimes; this is called an unstable state. Once an Oops has occurred, the system cannot be trusted any further.
在内核的关键点中,常常预设一些判断条件来捕获内核的异常,如果这些条件成立表明内核出现了bug或者warn。内核会调用panic复位或者仅仅打印一条warning消息。
2.1.BUG_ON()
 52 #ifndef HAVE_ARCH_BUG
 53 #define BUG() do { \
 54     printk("BUG: failure at %s:%d/%s()!\n", __FILE__, __LINE__, __func__); \
 55     barrier_before_unreachable(); \
 56     panic("BUG!"); \
 57 } while (0)
 58 #endif
 59
 60 #ifndef HAVE_ARCH_BUG_ON
 61 #define BUG_ON(condition) do { if (unlikely(condition)) BUG(); } while (0)
 62 #endif
What does BUG() macro do?
- Prints the contents of the registers
- Prints Stack Trace
- Current Process dies
2.2.die()
BUG_ON()捕获的是一些预置异常,而die函数用来处理系统中的一些动态异常,比如非法地址访问、非法指令、除0异常等等,这些异常会触发cpu的异常处理程序,最终都会调用die()函数来处理。
arch/arm/kernel/traps.c:
347 void die(const char *str, struct pt_regs *regs, int err)
348 {
349     enum bug_trap_type bug_type = BUG_TRAP_TYPE_NONE;
350     unsigned long flags = oops_begin();
351     int sig = SIGSEGV;
352
353     if (!user_mode(regs))
354         bug_type = report_bug(regs->ARM_pc, regs);
355     if (bug_type != BUG_TRAP_TYPE_NONE)
356         str = "Oops - BUG";
357
358     if (__die(str, err, regs))
359         sig = 0;
360
361     oops_end(flags, regs, sig);
362 }
363
2.3.panic()
BUG_ON()和die()的处理中,如果决定复位系统就会调用panic()。panic()函数做一些复位前的处理然后复位系统。
3.Example
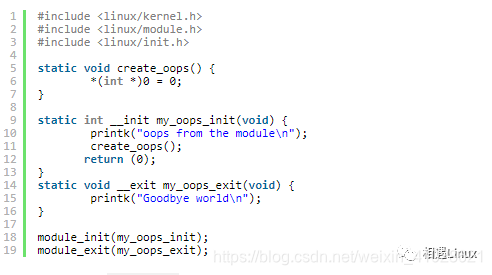
Once executed, the module generates the following Oops:
BUG: unable to handle kernel NULL pointer dereference at (null)
IP: [<ffffffffa03e1012>] my_oops_init+0x12/0x21 [oops]
PGD 7a719067 PUD 7b2b3067 PMD 0
Oops: 0002 [#1] SMP
last sysfs file: /sys/devices/virtual/misc/kvm/uevent
CPU 1
Pid: 2248, comm: insmod Tainted: P           2.6.33.3-85.fc13.x86_64
RIP: 0010:[<ffffffffa03e1012>]  [<ffffffffa03e1012>] my_oops_init+0x12/0x21 [oops]
RSP: 0018:ffff88007ad4bf08  EFLAGS: 00010292
RAX: 0000000000000018 RBX: ffffffffa03e1000 RCX: 00000000000013b7
RDX: 0000000000000000 RSI: 0000000000000046 RDI: 0000000000000246
RBP: ffff88007ad4bf08 R08: ffff88007af1cba0 R09: 0000000000000004
R10: 0000000000000000 R11: ffff88007ad4bd68 R12: 0000000000000000
R13: 00000000016b0030 R14: 0000000000019db9 R15: 00000000016b0010
FS:  00007fb79dadf700(0000) GS:ffff880001e80000(0000) knlGS:0000000000000000
CS:  0010 DS: 0000 ES: 0000 CR0: 000000008005003b
CR2: 0000000000000000 CR3: 000000007a0f1000 CR4: 00000000000006e0
DR0: 0000000000000000 DR1: 0000000000000000 DR2: 0000000000000000
DR3: 0000000000000000 DR6: 00000000ffff0ff0 DR7: 0000000000000400
Process insmod (pid: 2248, threadinfo ffff88007ad4a000, task ffff88007a222ea0)

Stack:
ffff88007ad4bf38 ffffffff8100205f ffffffffa03de060 ffffffffa03de060
 0000000000000000 00000000016b0030 ffff88007ad4bf78 ffffffff8107aac9
 ffff88007ad4bf78 00007fff69f3e814 0000000000019db9 0000000000020000

Call Trace:
[<ffffffff8100205f>] do_one_initcall+0x59/0x154
[<ffffffff8107aac9>] sys_init_module+0xd1/0x230
[<ffffffff81009b02>] system_call_fastpath+0x16/0x1b

Code: <c7> 04 25 00 00 00 00 00 00 00 00 31 c0 c9 c3 00 00 00 00 00 00 00
RIP  [<ffffffffa03e1012>] my_oops_init+0x12/0x21 [oops]
RSP <ffff88007ad4bf08>
CR2: 0000000000000000
分析Oops dump:
1>.BUG: unable to handle kernel NULL pointer dereference at (null)
- The first line indicates a pointer with a NULL value.
2>.IP: [] my_oops_init+0x12/0x21 [oops]
- IP is the instruction pointer.
- 告诉我们内核是执行到 my_oops_init+0x12/0x21 这个地址处出错的,那么我们需要做的就是找到这个地址对应的代码格式为函数+偏移/长度。my_oops_init指示了在first_drv_open中出现的异常:
- 0x12表示出错的偏移位置
- 0x21 表示first_drv_open函数的大小
3>.PGD 7a719067 PUD 7b2b3067 PMD 0
- 试图访问的地址(本例中为0)的页表的信息
4>.Oops: 0002 [#1] SMP
- This is the error code value in hex. Each bit has a significance of its own:
bit 0 == 0 means no page found, 1 means a protection fault
bit 1 == 0 means read, 1 means write
bit 2 == 0 means kernel, 1 means user-mode
[#1] — this value is the number of times the Oops occurred. Multiple Oops can be triggered as a cascading effect of the first one.
5>.CPU 1
- This denotes on which CPU the error occurred.
6>.Pid: 2248, comm: insmod Tainted: P 2.6.33.3-85.fc13.x86_64
- The Tainted flag points to P here. Each flag has its own meaning. A few other flags, and their meanings, picked up from kernel/panic.c:
P — Proprietary module has been loaded.
F — Module has been forcibly loaded.
S — SMP with a CPU not designed for SMP.
R — User forced a module unload.
M — System experienced a machine check exception.
B — System has hit bad_page.
U — Userspace-defined naughtiness.
A — ACPI table overridden.
W — Taint on warning.
7>.RIP: 0010:[] [] my_oops_init+0x12/0x21 [oops]
- RIP is the CPU register containing the address of the instruction that is getting executed (错误发生的地址).0010 comes from the code segment register. my_oops_init+0x12/0x21 is the + the offset/length.(错误发生的地址是my_oops_init函数的第0x12个字节,最后的0x21是my_oops_init函数的大小)
8>.RSP: 0018:ffff88007ad4bf08 EFLAGS: 00010292RAX: 0000000000000018 RBX: ffffffffa03e1000 RCX: 00000000000013b7RDX: 0000000000000000 RSI: 0000000000000046 RDI: 0000000000000246RBP: ffff88007ad4bf08 R08: ffff88007af1cba0 R09: 0000000000000004R10: 0000000000000000 R11: ffff88007ad4bd68 R12: 0000000000000000R13: 00000000016b0030 R14: 0000000000019db9 R15: 00000000016b0010
- This is a dump of the contents of some of the CPU registers.
9>.Stack:ffff88007ad4bf38 ffffffff8100205f ffffffffa03de060 ffffffffa03de060 0000000000000000 00000000016b0030 ffff88007ad4bf78 ffffffff8107aac9 ffff88007ad4bf78 00007fff69f3e814 0000000000019db9 0000000000020000
- The above is the stack trace.
10>.Call Trace:[] do_one_initcall+0x59/0x154[] sys_init_module+0xd1/0x230[] system_call_fastpath+0x16/0x1b
- The above is the call trace — the list of functions being called just before the Oops occurred.
11>.Code: 04 25 00 00 00 00 00 00 00 00 31 c0 c9 c3 00 00 00 00 00 00 00
- The Code is a hex-dump of the section of machine code that was being run at the time the Oops occurred.(错误发生时RIP指向的地址处的开头20个字节的代码)
3.1.Debugging an Oops dump
-
[root@DELL-RnD-India oops]# gdb oops.ko
GNU gdb (GDB) Fedora (7.1-18.fc13)Reading symbols from /code/oops/oops.ko…done.(gdb) add-symbol-file oops.o 0xffffffffa03e1000add symbol table from file “oops.o” at .text_addr = 0xffffffffa03e1000 -
(gdb) disassemble my_oops_init
Dump of assembler code for function my_oops_init: 0x0000000000000038 <+0>: push %rbp 0x0000000000000039 <+1>: mov $0x0,%rdi 0x0000000000000040 <+8>: xor %eax,%eax 0x0000000000000042 <+10>: mov %rsp,%rbp 0x0000000000000045 <+13>: callq 0x4a <my_oops_init+18> 0x000000000000004a <+18>: movl $0x0,0x0 0x0000000000000055 <+29>: xor %eax,%eax 0x0000000000000057 <+31>: leaveq 0x0000000000000058 <+32>: retqEnd of assembler dump. -
Now, to pin point the actual line of offending code, we add the starting address and the offset. The offset is available in the same RIP instruction line. In our case, we are adding 0x0000000000000038 + 0x012 = 0x000000000000004a. This points to the movl instruction.
(gdb) list *0x000000000000004a
0x4a is in my_oops_init (/code/oops/oops.c:6).1 #include <linux/kernel.h>2 #include <linux/module.h>3 #include <linux/init.h>4 5 static void create_oops() {6 *(int *)0 = 0;7 }
refer to
- https://gist.github.com/robbie-cao/32af7001443ac0b959abdf6ad6de2c9f
- kernel/Documentation/oops-tracing.txt
