图例:信息框图例,每条线的信息
- plt
import numpy as np
import matplotlib.pyplot as plt
x= np.arange(1, 11, 1)
plt.plot(x, x**2, label='Normal')
plt.plot(x, x**3, label='fast')
plt.plot(x, x**4, label='faster')
plt.legend(loc=0, ncol=3)
#loc表示出现位置,0为最佳,1是右上角,逆时针增加
#ncol将三行变成三列
plt.show()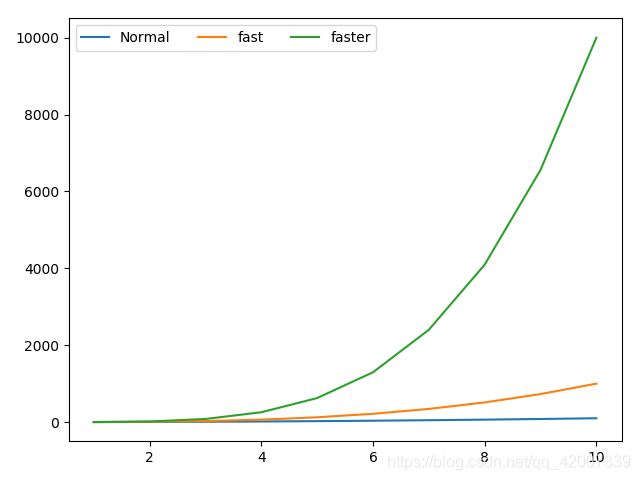
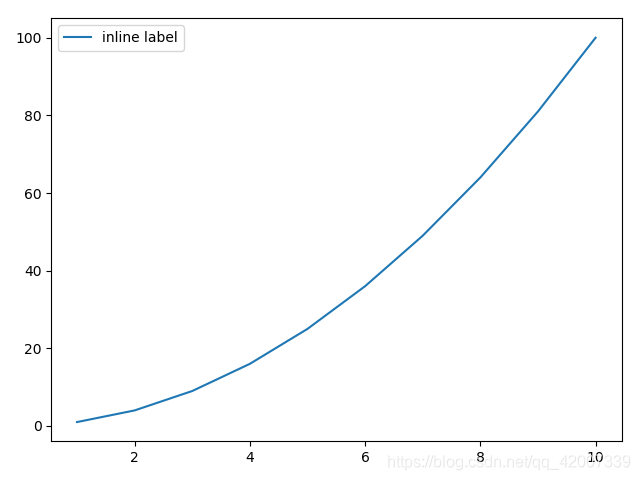
- 面向对象
x= np.arange(1, 11, 1)
fig = plt.figure()
ax = fig.add_subplot(111)
plt.plot(x, x**2, label='inline label')
ax.legend()
plt.show()