grafana 7.0.1 设置
1,grafana 7.0.1 设置
- grafana版本
# grafana-server -v
Version 7.0.1 (commit: ef5b586d7d, branch: HEAD)
2,grafana Unit设置
name: 'Data Rate'
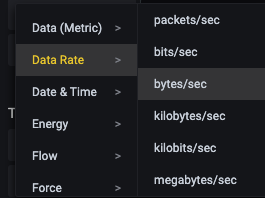
- 设置数据参数

3,交换分区监控
- 总交换区
node_memory_SwapTotal_bytes{instance=~"$node"}
- 空闲swap
node_memory_SwapFree_bytes{instance=~"$node"}
- 已用swap
node_memory_SwapTotal_bytes{instance=~"$node"} - node_memory_SwapFree_bytes{instance=~"$node"}
参考: