from selenium import webdriver
import os
from time import sleep
import xlwt
bookwork = xlwt.Workbook(encoding='utf-8')
sheetbook = bookwork.add_sheet('国内疫情数据')
title =['地区','现有确诊','累计确诊','治愈','死亡']for i inrange(len(title)):
sheetbook.write(0,i,title[i])# 限制图片加载
options = webdriver.ChromeOptions()
prefs ={'profile.default_content_setting_values':{'images':2,#限制图片加载'permissions.default.stylesheet':2,#限制css样式加载# 'javascript':2}}
options.add_experimental_option('prefs', prefs)
options.add_argument('headless')#设置无浏览器界面运行
driver = webdriver.Chrome(chrome_options=options)
link ='https://news.qq.com/zt2020/page/feiyan.htm#/?nojump=1'
driver.get(link)
sleep(3)
time = driver.find_element_by_xpath('//*[@id="app"]/div[2]/div[3]/div[1]/div[2]/p/span').text
print(time)
time = time.split(' ')
time = time[0]print(time)dir= driver.find_element_by_id('listWraper')
table = driver.find_elements_by_xpath('//*[@id="listWraper"]/table[2]/tbody')print(len(table))
num =1for i in table:
name = i.find_element_by_tag_name('th').text
td = i.find_elements_by_tag_name('td')
current = td[0].find_element_by_tag_name('p').text
history = td[1].find_element_by_tag_name('p').text
head = td[2].find_element_by_tag_name('p').text
dead = td[3].find_element_by_tag_name('p').text
sheetbook.write(num,0,name)
sheetbook.write(num,1,current )
sheetbook.write(num,2,history)
sheetbook.write(num,3,head)
sheetbook.write(num,4,dead)print(name,current,history,head,dead)
num = num +1
bookwork.save(time[5:]+'国内疫情数据.xlsx')print('更新完成')
driver.quit()#关闭浏览器
生成地图
# V1 版本开始支持链式调用#coding = utf-8from pyecharts import options as opts
from pyecharts.charts import Map
from pyecharts.globalsimport ThemeType # 主题from snapshot_selenium import snapshot as driver
from pyecharts.render import make_snapshot
import xlrd
filename ='06-10国内疫情数据.xlsx'file= xlrd.open_workbook(filename)
sheet =file.sheet_by_name('国内疫情数据')
cityname = sheet.col_values(0)# 获取城市名
number = sheet.col_values(1)# 获取城市现有确诊人数
data =[]for i inrange(1,len(cityname)):list=[]list.append(cityname[i])list.append(number[i])
data.append(list)# 设置地图参数map=(
Map(init_opts=opts.InitOpts(bg_color="#FFFAFA", theme=ThemeType.ESSOS, width=1000)).add("现存确诊人数", data).set_global_opts(
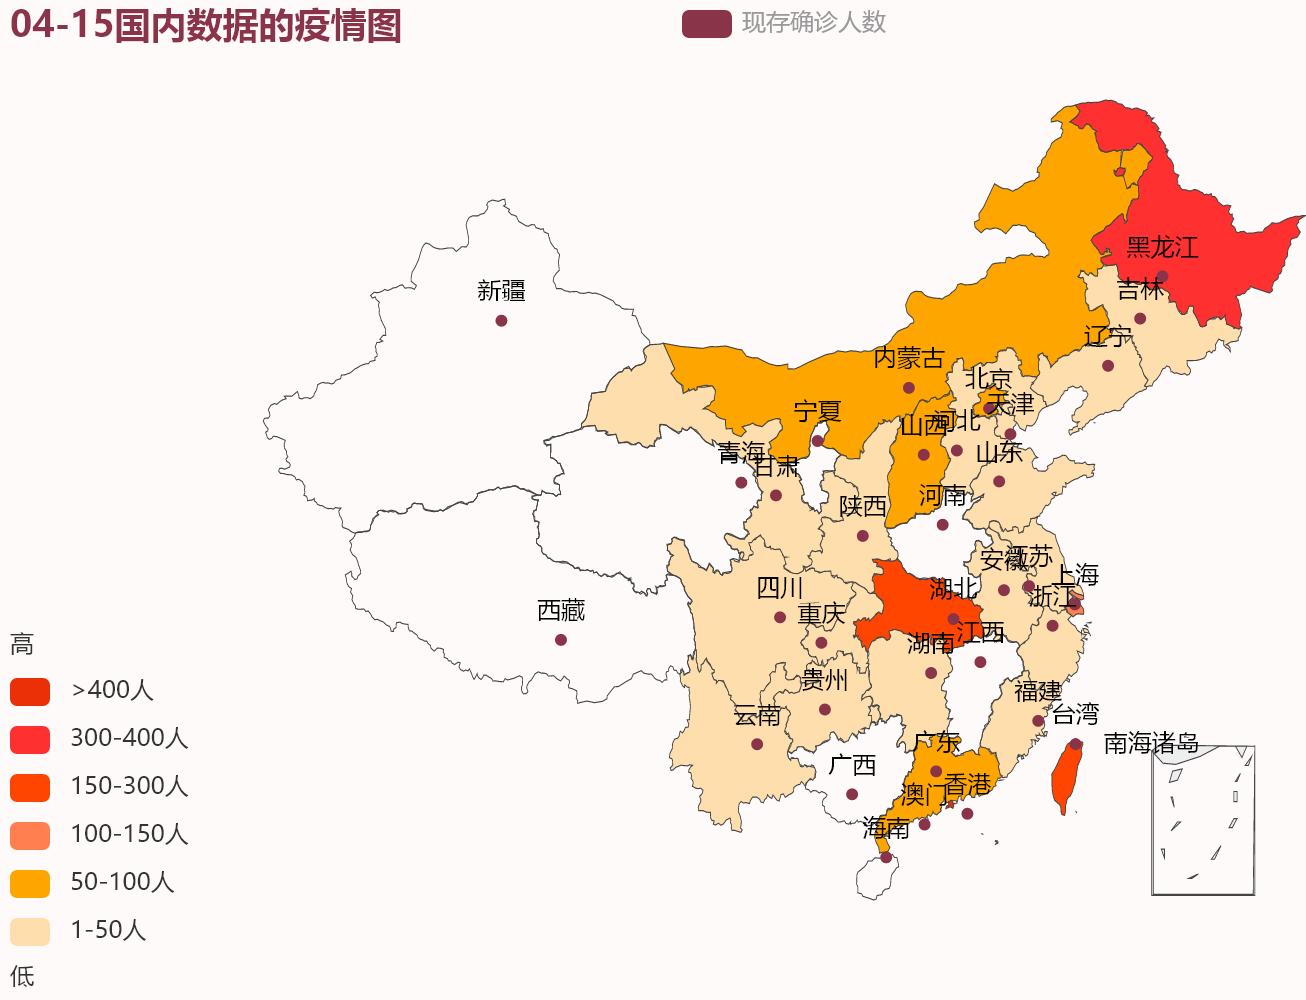
title_opts=opts.TitleOpts(title=filename[0:5]+"国内数据的疫情图"),
visualmap_opts=opts.VisualMapOpts(
is_piecewise=True,# 设置是否为分段显示# 自定义的每一段的范围,以及每一段的文字,以及每一段的特别的样式。例如:
pieces=[{"min":400,"label":'>400人',"color":"#eb2f06"},{"min":300,"max":400,"label":'300-400人',"color":"#FF3030"},# 不指定 max,表示 max 为无限大(Infinity)。{"min":150,"max":300,"label":'150-300人',"color":"#FF4500"},{"min":100,"max":150,"label":'100-150人',"color":"#FF7F50"},{"min":50,"max":100,"label":'50-100人',"color":"#FFA500"},{"min":1,"max":50,"label":'1-50人',"color":"#FFDEAD"},],# 两端的文本,如['High', 'Low']。
range_text=['高','低'],),))
make_snapshot(driver,map.render('F:/CODE/爬虫/可视化疫情2/中国疫情人数地图.html'),"F:/CODE/爬虫/可视化疫情2/chinese_map.png")