声明部分
%matplotlib inline   #在jupyter里显示绘图窗口
import matplotlib.pyplot as plt

#plt.style.use(['science', 'no-latex'])   #SCI绘图风格
plt.rcParams['font.sans-serif'] = ['SimHei']  # 用来正常显示中文标签
plt.rcParams['axes.unicode_minus'] = False  # 用来正常显示负号

import warnings
warnings.filterwarnings("ignore")  # 不显示警告
绘图部分
线条风格:

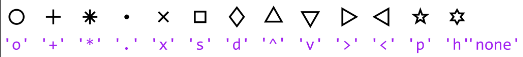
线条标记:
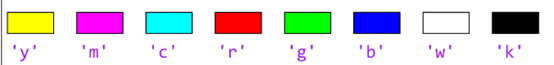
线条颜色:
图例:
#以默认方式,正常显示图例
plt.plot(test1, 'r-', label="test1",linewidth=2)
plt.plot(test2, 'b-.', label="test2",linewidth=2)
plt.legend()


#自定义图例
p1, = plt.plot(x1, y1, 'bo-', label='我是p1')
p2, = plt.plot(x2, y2, 'rs-', label='我是p2')
plt.legend(handles=[p1,p2],prop={'size':15},fancybox=True,framealpha=1, loc = 'lower right', bbox_to_anchor=(1, 0.25))
↓↓↓参数说明↓↓↓
prop:字体参数;
fancybox:是否将图例框的边角设为圆形;
framealpha:控制图例框的透明度;
loc:图例位置,可取(‘best’, ‘upper right’, ‘upper left’, ‘lower left’, ‘lower right’, ‘right’, ‘center left’, ‘center , right’, ‘lower center’, ‘upper center’, ‘center’) ;
bbox_to_anchor=(1, 0.25):确定图例在轴的位置,如果出现图例遮盖了图像便需要调整。如果需要将图例放在图像外,需要loc和bbox_to_anchor配合使用。
横纵坐标相关:
plt.grid()  #加网格
plt.xlabel('横坐标')
plt.ylabel('纵坐标')
plt.title('我是标题')  #添加标题
plt.axis([xmin, xmax, ymin, ymax])   #确定坐标范围
plt.text(60, .025, r'$\mu=100,\ \sigma=15$') #plt.text()在指定位置添加文字说明,支持LaTex语法

plt.tight_layout()   #自动调整子图参数,使之填充整个图像区域
plt.savefig('1.pdf', format='pdf')   #以PDF格式保存图片

plt.xticks([0, 6000, 12000, 18000, 24000, 30000, 36000, 42000, 48000], [0, 6, 12, 18, 24, 30, 36, 42, 48])
plt.yticks([250000, 500000, 750000, 1000000, 1250000, 1500000], [250,500,750,1000,1250,1500])       #转化为合适的横纵坐标单位
基础案例
plt.figure()
plt.plot(test1, 'r-', label="test1",linewidth=2)
plt.plot(test2, 'b-.', label="test2",linewidth=2)
plt.xlabel("Iterations")
plt.ylabel("NMSE (dB)")
plt.legend()  # 以默认方式,正常显示label
plt.savefig("1.jpg", dpi=500)
plt.show()
参考:
https://www.cnblogs.com/zhizhan/p/5615947.html