原文链接:http://tecdat.cn/?p=13247
本文我们绘制英国脱欧投票的地图。第一步是绘制底图
library(sp)
library(raster)
download.file("http://biogeo.ucdavis.edu/data/gadm2.8/rds/GBR_adm2.rds","GBR_adm2.rds")
UK=readRDS("GBR_adm2.rds")
UK@data[159,"HASC_2"]="GB.NR"
plot(UK, xlim = c(-4,-2), ylim = c(50, 59), main="UK areas")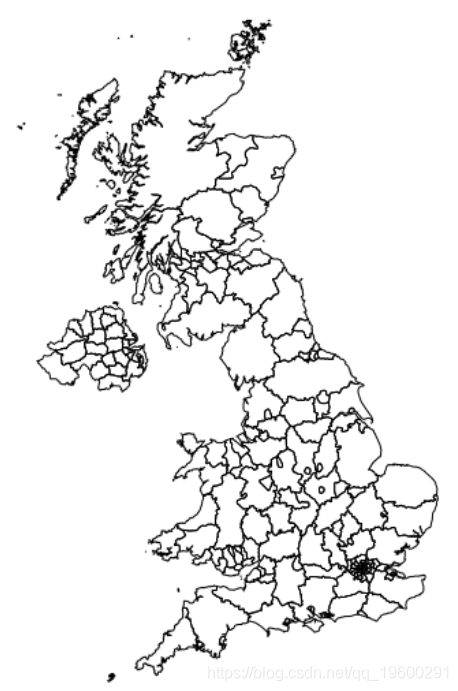
添加爱尔兰
plot(IRL,add=TRUE)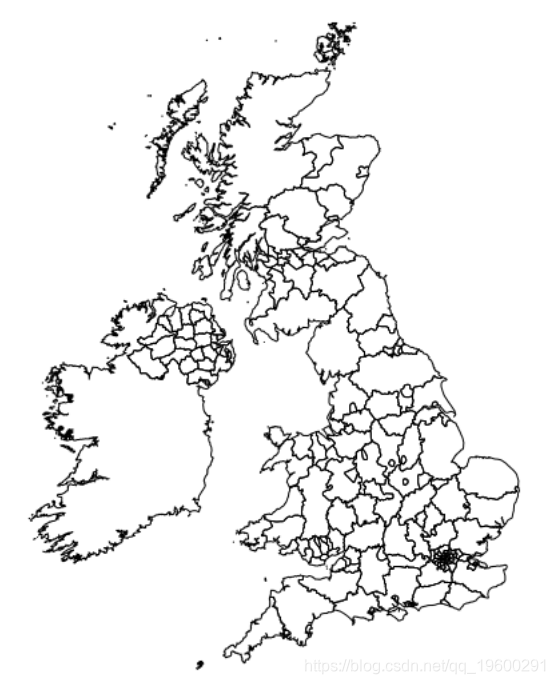
添加法国,它位于右下方,因此我们应该看到一点…
plot(FR,add=TRUE)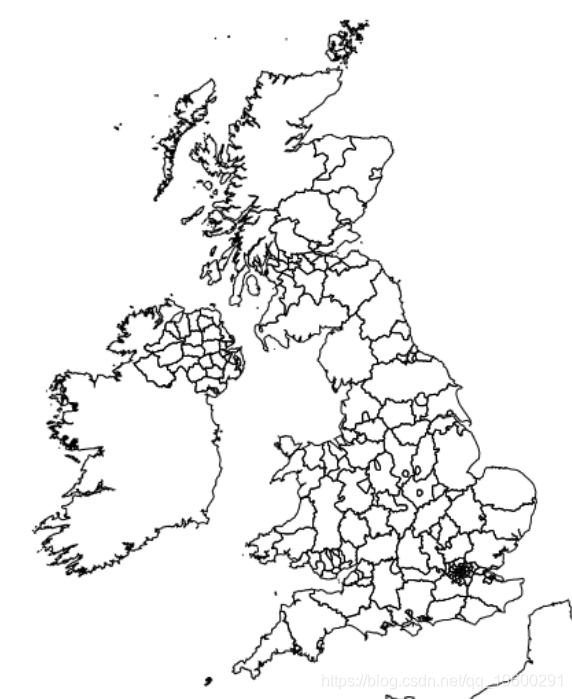
然后,我们可以检索英国退欧公投数据
referendum=ddply(referendum,.(Region,HASC_code),summarise,Remain=sum(Remain),Leave=sum(Leave))我们可以发现,脱欧赢得了51.89%的选票
> sum(referendum$Leave)/(sum(referendum$Leave)+sum(referendum$Remain))
[1] 0.5189184
大家可以看一下,使用
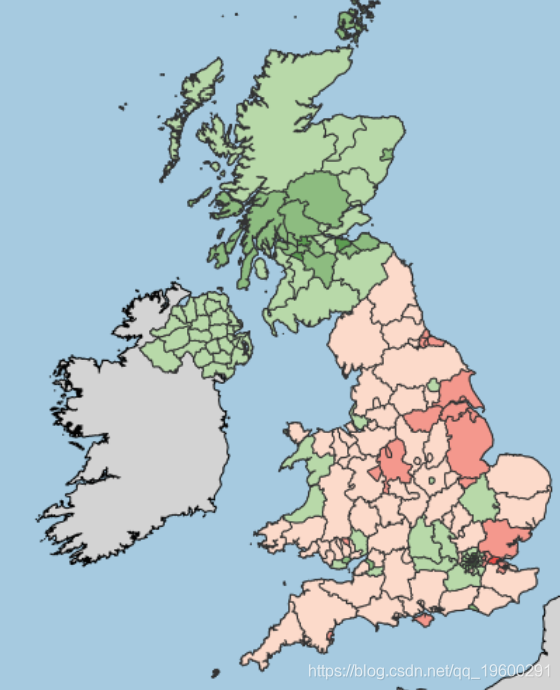
plot(UK, col = map_data$Brexit, border = "gray1", xlim = c(-4,-2), ylim = c(50, 59), main="How the UK has voted?", bg="#A6CAE0")
plot(IRL, col = "lightgrey", border = "gray1",add=TRUE)
plot(FR, col = "lightgrey", border = "gray1",add=TRUE)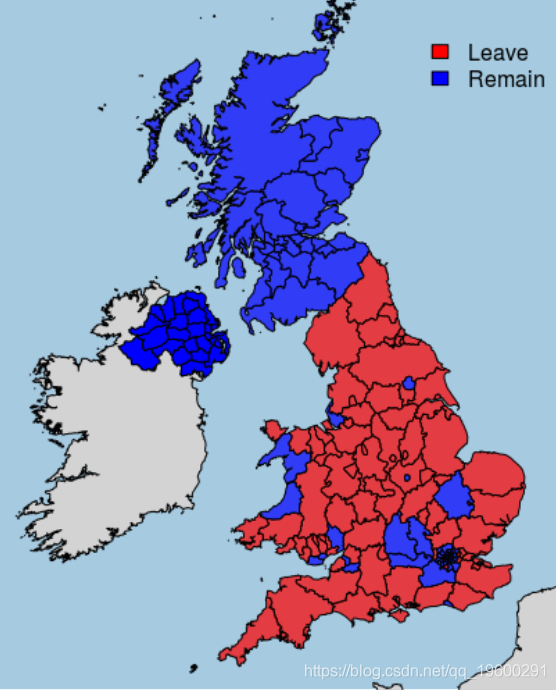
(我们添加了一个小图例以使其更清晰)。为此,我们可以使用制图软件包
plot(UK, col = "grey", border = "gray1", xlim = c(-4,-2), ylim = c(50, 59),bg="#A6CAE0")
plot(IRL, col = "lightgrey", border = "gray1",add=TRUE)
plot(FR, col = "lightgrey", border = "gray1",add=TRUE)
choroLayer(spdf = UK,
df = map_data,
var = "Percentage_Remain",
breaks = seq(0,100,10),
col = cols,
legend.pos = "topright",
legend.title.txt = "",
legend.values.rnd = 2,
add = TRUE)