上一篇了解了GeoJSON的格式
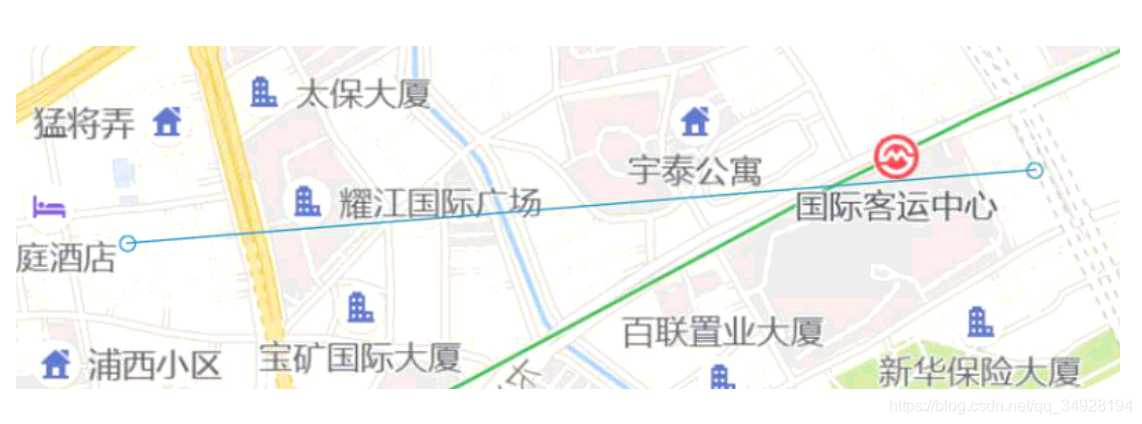
在项目中我获取到后台坐标数据后,构建了GeoJSON数据,然后通过openlayers展示点绘制线
示例代码如下:
<!DOCTYPE html>
<html lang="en">

<head>
    <meta charset="UTF-8">
    <meta name="viewport" content="width=device-width, initial-scale=1.0">
    <title>openlayers学习-5.openlayers使用GeoJSON绘制点、线</title>
    <link href="./css/ol.css" rel="stylesheet" type="text/css" />
    <script src="./js/ol.js" type="text/javascript"></script>
    <style>
        html,
        body {
            height: 100%;
            width: 100%;
            overflow: hidden;
        }
    </style>
</head>

<body>
    <div id="map" style="height: 100%; width: 100%; overflow: hidden"></div>
</body>
<script>
    // 中心点坐标 ('EPSG:4326', 'EPSG:3857' 坐标系知识参考博客https://www.cnblogs.com/E7868A/p/11460865.html)
    var center_point = ol.proj.transform([121.487899486, 31.24916171], 'EPSG:4326', 'EPSG:3857');
    // 高德地图源
    var gaodeMapLayer = new ol.layer.Tile({
        source: new ol.source.XYZ({
            url: 'http://wprd0{1-4}.is.autonavi.com/appmaptile?lang=zh_cn&size=1&style=7&x={x}&y={y}&z={z}'
        })
    });

    // 创建地图
    var map = new ol.Map({
        // 让id为map的div作为地图的容器
        target: 'map',
        // 设置地图图层
        layers: [
            // 创建一个使用Open Street Map地图源的瓦片图层
            //new ol.layer.Tile({source: new ol.source.OSM()})
            gaodeMapLayer
        ],
        // 设置显示地图的视图
        view: new ol.View({
            center: center_point,    // 定义地图显示中心
            zoom: 14            // 定义地图显示层级
        }),
        // 设置地图控件,默认的三个控件都不显示
        controls: ol.control.defaults({
            attribution: false,
            rotate: false,
            zoom: false
        })
    });

    var reader = new ol.format.GeoJSON({
        defaultDataProjection: 'EPSG:4326',
        featureProjection: 'EPSG:3857'
    });
    // 构建GeoJSON数据,此处模拟生成多点数据
    function getPointGeoJSON() {
        var geoJson = {
            "type": "FeatureCollection",
            "features": [{
                "type": "Feature",
                "geometry": {
                    "type": "MultiPoint",
                    "coordinates": [
                        [121.487899486, 31.24916171],
                        [121.50, 31.25]
                    ]
                }
            }]
        };
        return geoJson;
    }
    // 绘制多点
    var pointLayer = new ol.layer.Vector();
    var pointSourceVector = new ol.source.Vector();
    pointLayer.setSource(pointSourceVector);
    map.addLayer(pointLayer);
    pointSourceVector.addFeatures(reader.readFeatures(getPointGeoJSON()));


    // 构建GeoJSON数据,此处模拟生成绘线的GeoJson数据
    function getLineGeoJSON() {
        var geoJson = {
            "type": "FeatureCollection",
            "features": [{
                "type": "Feature",
                "geometry": {
                    "type": "LineString",
                    "coordinates": [
                        [121.487899486, 31.24916171],
                        [121.50, 31.25]
                    ]
                }
            }]
        };
        return geoJson;
    }
    // 绘制线
    var lineLayer = new ol.layer.Vector();
    var lineSourceVector = new ol.source.Vector();
    lineLayer.setSource(lineSourceVector);
    map.addLayer(lineLayer);
    lineSourceVector.addFeatures(reader.readFeatures(getLineGeoJSON()));
</script>
</html>
效果: