Android 使用Webview控件来实现【数据图表(HTML+JS)】的显示
首先在xml文件上界面布局
这边采用LinearLayour布局,首先添加一个webview控件来显示不同的数据图表,第二添加3个button控件来切换不同的数据图表
代码如下:
<?xml version="1.0" encoding="utf-8"?>
<LinearLayout
	xmlns:android="http://schemas.android.com/apk/res/android"
	xmlns:tools="http://schemas.android.com/tools"
	android:layout_width="match_parent"
	android:layout_height="match_parent"
	android:orientation="vertical"
	tools:context=".MainActivity">

<WebView
    android:id="@+id/w1"
    android:layout_width="match_parent"
    android:layout_height="400dp"/>
    <LinearLayout
        android:layout_width="match_parent"
        android:layout_height="wrap_content"
        android:layout_marginTop="50dp"
        android:gravity="center"
        android:orientation="horizontal">
    <Button
        android:id="@+id/b1"
        android:layout_width="wrap_content"
        android:layout_height="wrap_content"
        android:text="折线图"/>
        <Button
            android:id="@+id/b2"
            android:layout_width="wrap_content"
            android:layout_height="wrap_content"
            android:text="树状图"/>
        <Button
            android:id="@+id/b3"
            android:layout_width="wrap_content"
            android:layout_height="wrap_content"
            android:text="饼状图"/>
        </LinearLayout>
</LinearLayout>
界面截图

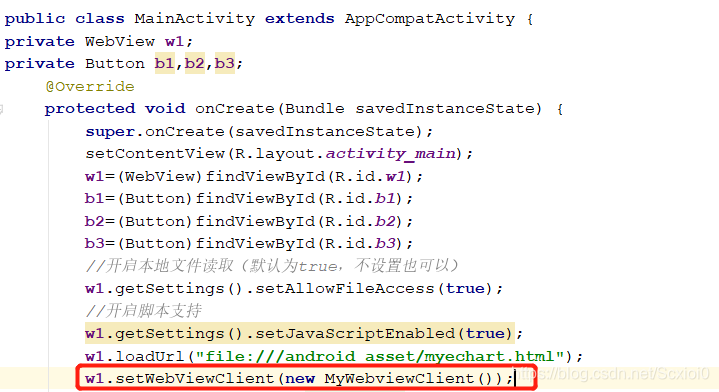
第二步:在Mainactivity.java完成功能的实现
第一:绑定id

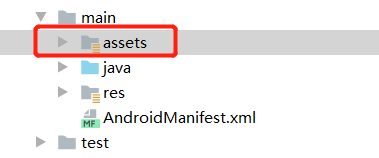
第三步:添加数据图表文件
第一:在main文件下创建一个assets文件夹
第二:在assets文件夹上添加(HTML+JS)文件
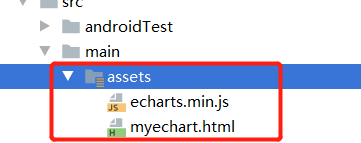
echarts.min.js文件可以从Echarts官网下载
之后根据情况编写我们的html文件
<!DOCTYPE html>
<!-- release v4.3.6, copyright 2014 - 2017 Kartik Visweswaran -->
<html lang="en">
<head>
    <meta charset="UTF-8" />
    <title>Android使用Echarts示例</title>


</head>

<body>
<div id="main" style="width: 100%; height: 350px;"></div>
<script src="./echarts.min.js"></script>
<script type="text/javascript">
window.addEventListener("resize",function(){


        option.chart.resize();
});
    //初始化路径
    var myChart;
     /**require.config({
            paths: {
                echarts: './'
            }
        });**/
    //  通用属性定义
    var options = {


                title : {


                    text : "Echart测试"
                },
                tooltip : {


                    show : false
                },
                toolbox : {


                    show : false
                },
            };


        function doCreatChart(type,jsondata){


        // 基于准备好的dom,初始化echarts实例
        var myChart = echarts.init(document.getElementById('main'));

        // 指定图表的配置项和数据
        var option = {


            title: {


                text: 'ECharts'
            },
            tooltip: {

     },
            legend: {


                data:['成绩']
            },
            xAxis: {


                data: ["数学","语文","英语","政治","物理","化学"]
            },
            yAxis: {

     },
            series: [{


                name: '成绩',
                type: type,
                data: jsondata
            }]
        };

        // 使用刚指定的配置项和数据显示图表。
        myChart.setOption(option);

        }


    //doCreatChart('line',[89,78,77,66,44,55]);
    //docreateChart('bar',[89,78,77]);
    //docreateChart('pie',[89,78,77]);
    </script>
</body>

</html>
第四步:返回Mainactivity.java文件继续完成相关的操作
第一:开启脚本支持和开启本地文件读取

第二:定义一个类来实现加载webview时需要完成什么
在倒数第二个花括号定义
class MyWebviewClient extend WebViewClient
{
}
    class MyWebviewClient extends WebViewClient
    {
        @Override
        public void onPageFinished(WebView view, String url) {
            super.onPageFinished(view, url);
            w1.loadUrl("javascript:doCreatChart('line',[89,78,77,44,66,83]);");
        }
    }
第三:启动接口
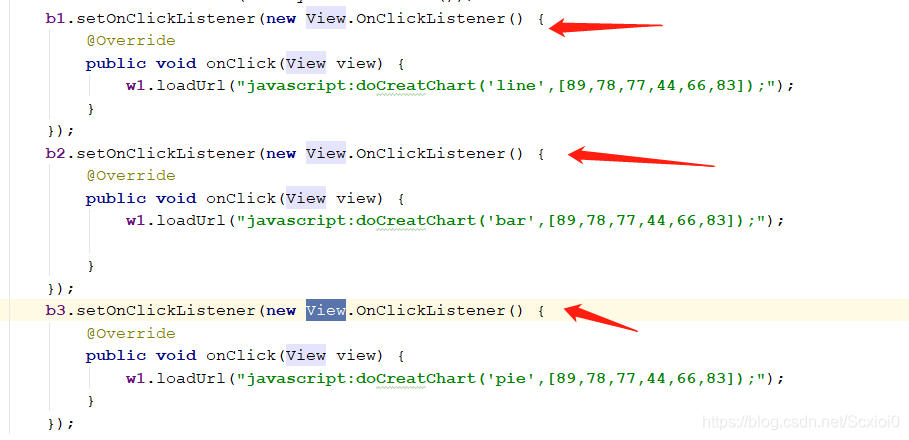
第四:3个按钮的监听事件(切换数据图表)
如果需要在真机使用软件,请在(AndroidManifest.xml)中的application输入以下代码,防止真机对网络请求不了
android:usesCleartextTraffic="true"
下面是本项目的源代码
https://download.csdn.net/download/Scxioi0/12910993