和一个国外的链接https://deparkes.co.uk/2015/03/11/how-to-plot-polygons-in-python/
1.引入shapely
from shapely.geometry import Point, Polygon, LineString2.点,线的缓冲区
点
# 定义点
point_1 = Point(1, 1)
# 两个点以指定的缓冲距离为半径生成圆形区域
a = point_1.buffer(2)
线
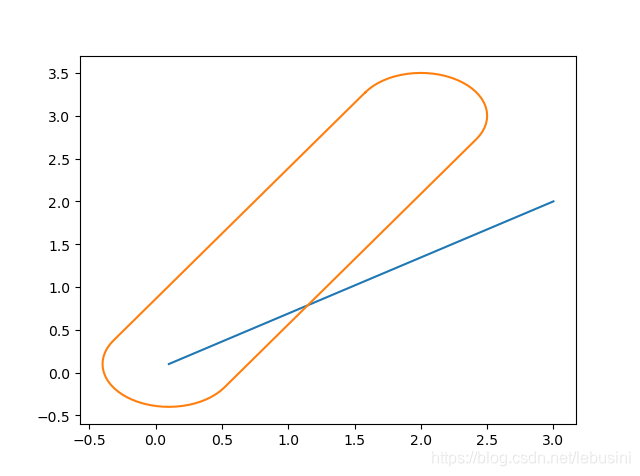
# 定义线段
line = LineString([(0.1, 0.1), (2, 3)])
# 生成缓冲区
buffer = line.buffer(0.5)
3.交并显示
线与缓冲区的交:
intersect=line.intersection(a)显示:
x1,y1=line.xy

x2,y2=buffer.boundary.xy

plt.figure()

plt.plot(x1,y1)

plt.plot(x2,y2)

plt.show()
显示结果: