综述
Matplotlib在figures上绘制数据(例如,窗口,Jupyter小部件等),每个figure都可以包含一个或多个axes,axes是可以根据x-y坐标(或极坐标中的theta-r或3-D图中的x-y-z等)指定点points的区域。
The object-oriented interface and the pyplot interface
使用matplotlilb绘图的两种方式:
- 显式地创建figures和axes,而后调用相应的method。适用于多图的时候,用axes布局?
- 依靠pyplot自动创建和管理figures和axes
使用subplots()可以创建figure和axes
x = np.linspace(0, 2, 100)

# Note that even in the OO-style, we use `.pyplot.figure` to create the figure.
fig, ax = plt.subplots()  # Create a figure and an axes.
ax.plot(x, x, label='linear')  # Plot some data on the axes.
ax.plot(x, x**2, label='quadratic')  # Plot more data on the axes...
ax.plot(x, x**3, label='cubic')  # ... and some more.
ax.set_xlabel('x label')  # Add an x-label to the axes.
ax.set_ylabel('y label')  # Add a y-label to the axes.
ax.set_title("Simple Plot")  # Add a title to the axes.
ax.legend()  # Add a legend.
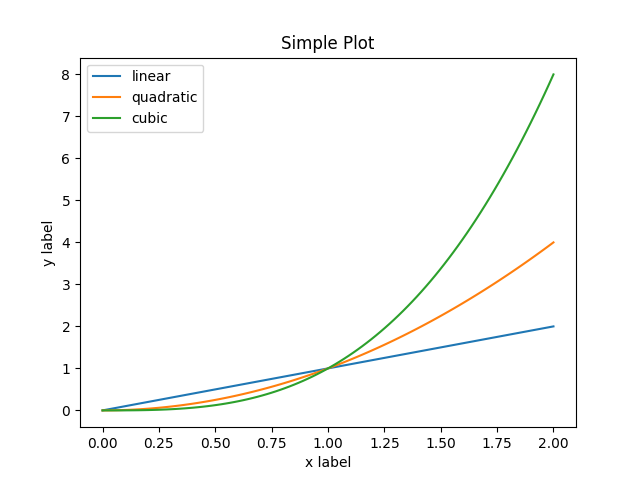
使用pyplot
x = np.linspace(0, 2, 100)

plt.plot(x, x, label='linear')  # Plot some data on the (implicit) axes.
plt.plot(x, x**2, label='quadratic')  # etc.
plt.plot(x, x**3, label='cubic')
plt.xlabel('x label')
plt.ylabel('y label')
plt.title("Simple Plot")
plt.legend()

Types of inputs to plotting functions
所有的绘图函数都需要用numpy.array or numpy.ma.masked_array作为输入。画图前最好先把数据转换成numpy.array,哪怕是pandas的数据框这种类似array的数据对象。
Figure 的组成成分
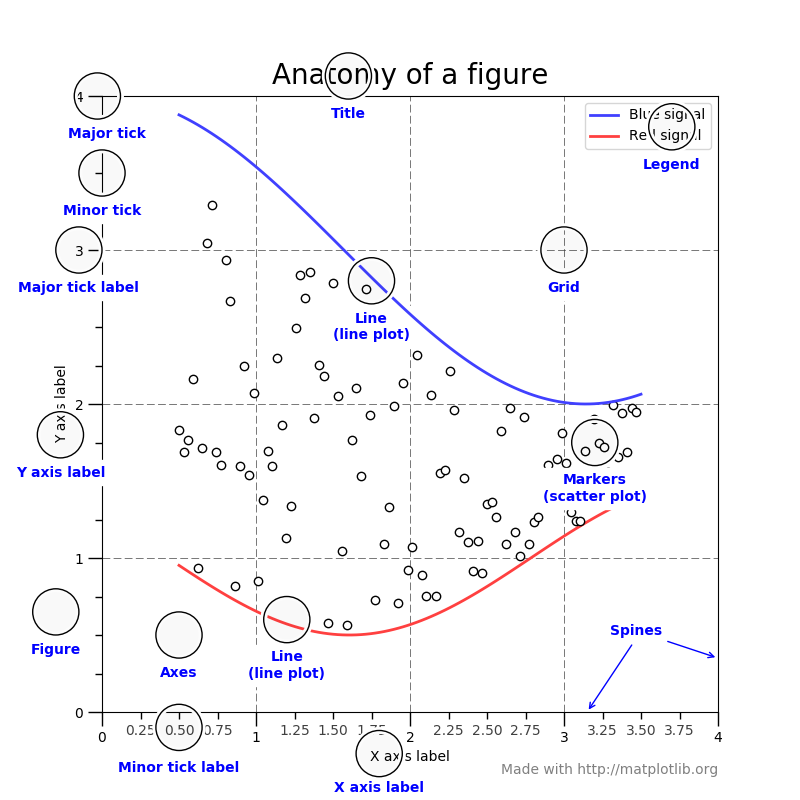
axes
可以理解成绘图区,它是具有数据空间的图像区域。 一个给定的figure可以包含多个axes,但是一个给定的Axes对象只能在一个figure中。 axes包含两个(或3个3D轴)轴对象(请注意轴和轴之间的差异),这些对象负责数据限制(数据限制也可以通过轴控制.Axes.set_xlim() 和axes.Axes.set_ylim()方法)。 每个轴都有一个标题(通过set_title()设置),一个x标签(通过set_xlabel()设置)和一个y标签(通过set_ylabel()设置)。
artist
et_xlabel()设置)和一个y标签(通过set_ylabel()`设置)。
artist
在figure上看到的所有东西基本上都是an artist (even the Figure, Axes, and Axis objects). 包括Text objects, Line2D objects, collections objects, Patch objects … .大多数 artist 都和axes是绑定的, 这样的artist不能被多个axes共享,也不能从一个axes移动到另一个axes。