作者:李毓
现在的helm仓库如下
[root@adm-master prometheus]# helm repo list
NAME        URL
charts      https://kubernetes.oss-cn-hangzhou.aliyuncs.com/charts
stable      http://mirror.azure.cn/kubernetes/charts
aliyuncs    https://apphub.aliyuncs.com
拉取peometheus 仓库
helm pull stable/prometheus
执行创建prometheus命令
[root@adm-master ~]# helm install  prometheus ./prometheus
WARNING: This chart is deprecated
NAME: prometheus
LAST DEPLOYED: Thu Mar 25 20:59:00 2021
NAMESPACE: monitor
STATUS: deployed
REVISION: 1
TEST SUITE: None
NOTES:
DEPRECATED and moved to <https://github.com/prometheus-community/helm-charts>The Prometheus server can be accessed via port 80 on the following DNS name from within your cluster:
prometheus-server.monitor.svc.cluster.local

Get the Prometheus server URL by running these commands in the same shell:
  export POD_NAME=$(kubectl get pods --namespace monitor -l "app=prometheus,component=server" -o jsonpath="{.items[0].metadata.name}")
  kubectl --namespace monitor port-forward $POD_NAME 9090

The Prometheus alertmanager can be accessed via port 80 on the following DNS name from within your cluster:
prometheus-alertmanager.monitor.svc.cluster.local

Get the Alertmanager URL by running these commands in the same shell:
  export POD_NAME=$(kubectl get pods -l "app=prometheus,component=alertmanager" -o jsonpath="{.items[0].metadata.name}")
  kubectl  port-forward $POD_NAME 9093
#################################################################################
######   WARNING: Pod Security Policy has been moved to a global property.  #####
######            use .Values.podSecurityPolicy.enabled with pod-based      #####
######            annotations                                               #####
######            (e.g. .Values.nodeExporter.podSecurityPolicy.annotations) #####
#################################################################################

The Prometheus PushGateway can be accessed via port 9091 on the following DNS name from within your cluster:
prometheus-pushgateway.monitor.svc.cluster.local

Get the PushGateway URL by running these commands in the same shell:
  export POD_NAME=$(kubectl get pods --namespace monitor -l "app=prometheus,component=pushgateway" -o jsonpath="{.items[0].metadata.name}")
  kubectl --namespace monitor port-forward $POD_NAME 9091

For more information on running Prometheus, visit:
https://prometheus.io/
拉取grafana
helm pull stable/grafana
[root@adm-master ~]# helm install grafana ./grafana
WARNING: This chart is deprecated
NAME: grafana
LAST DEPLOYED: Thu Mar 25 22:15:09 2021
NAMESPACE: default
STATUS: deployed
REVISION: 1
NOTES:
*******************
****DEPRECATED*****
*******************
* The chart is deprecated. Future development has been moved to https://github.com/grafana/helm2-grafana

1. Get your 'admin' user password by running:

   kubectl get secret --namespace default grafana -o jsonpath="{.data.admin-password}" | base64 --decode ; echo

2. The Grafana server can be accessed via port 80 on the following DNS name from within your cluster:

   grafana.default.svc.cluster.local

   Get the Grafana URL to visit by running these commands in the same shell:

     export POD_NAME=$(kubectl get pods --namespace default -l "app.kubernetes.io/name=grafana,app.kubernetes.io/instance=grafana" -o jsonpath="{.items[0].metadata.name}")
     kubectl --namespace default port-forward $POD_NAME 3000

3. Login with the password from step 1 and the username: admin
#################################################################################
######   WARNING: Persistence is disabled!!! You will lose your data when   #####
######            the Grafana pod is terminated.                            #####
#################################################################################

[root@adm-master ~]# kubectl get secret --namespace default grafana -o jsonpath="{.data.admin-password}" | base64 --decode ; echo
G7ylRPHYL4aMGUxWv9YMPShZ6st9TCn1WLbmQlfi
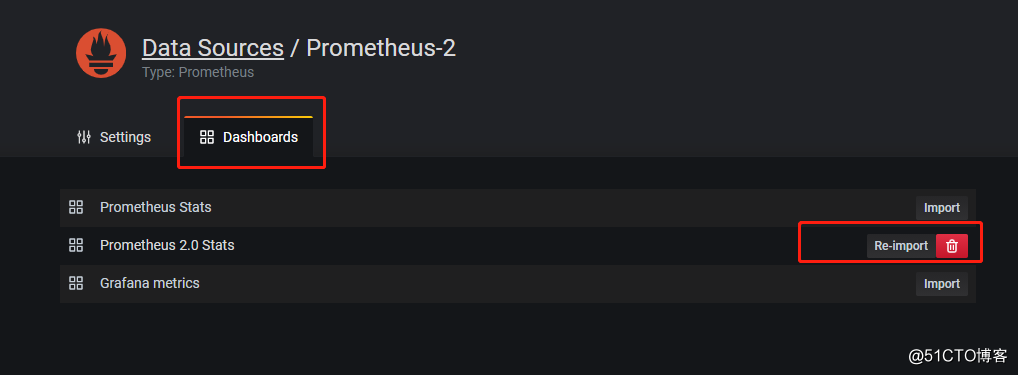
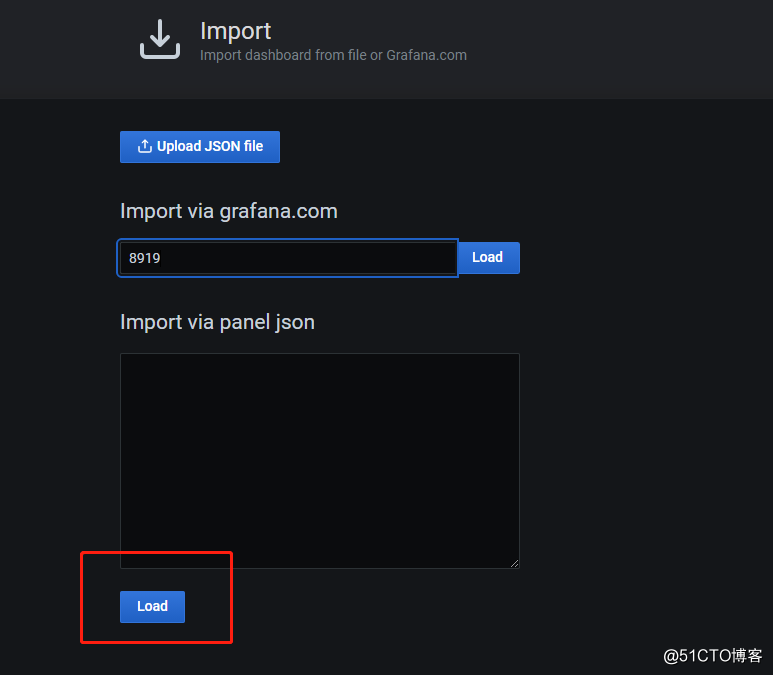
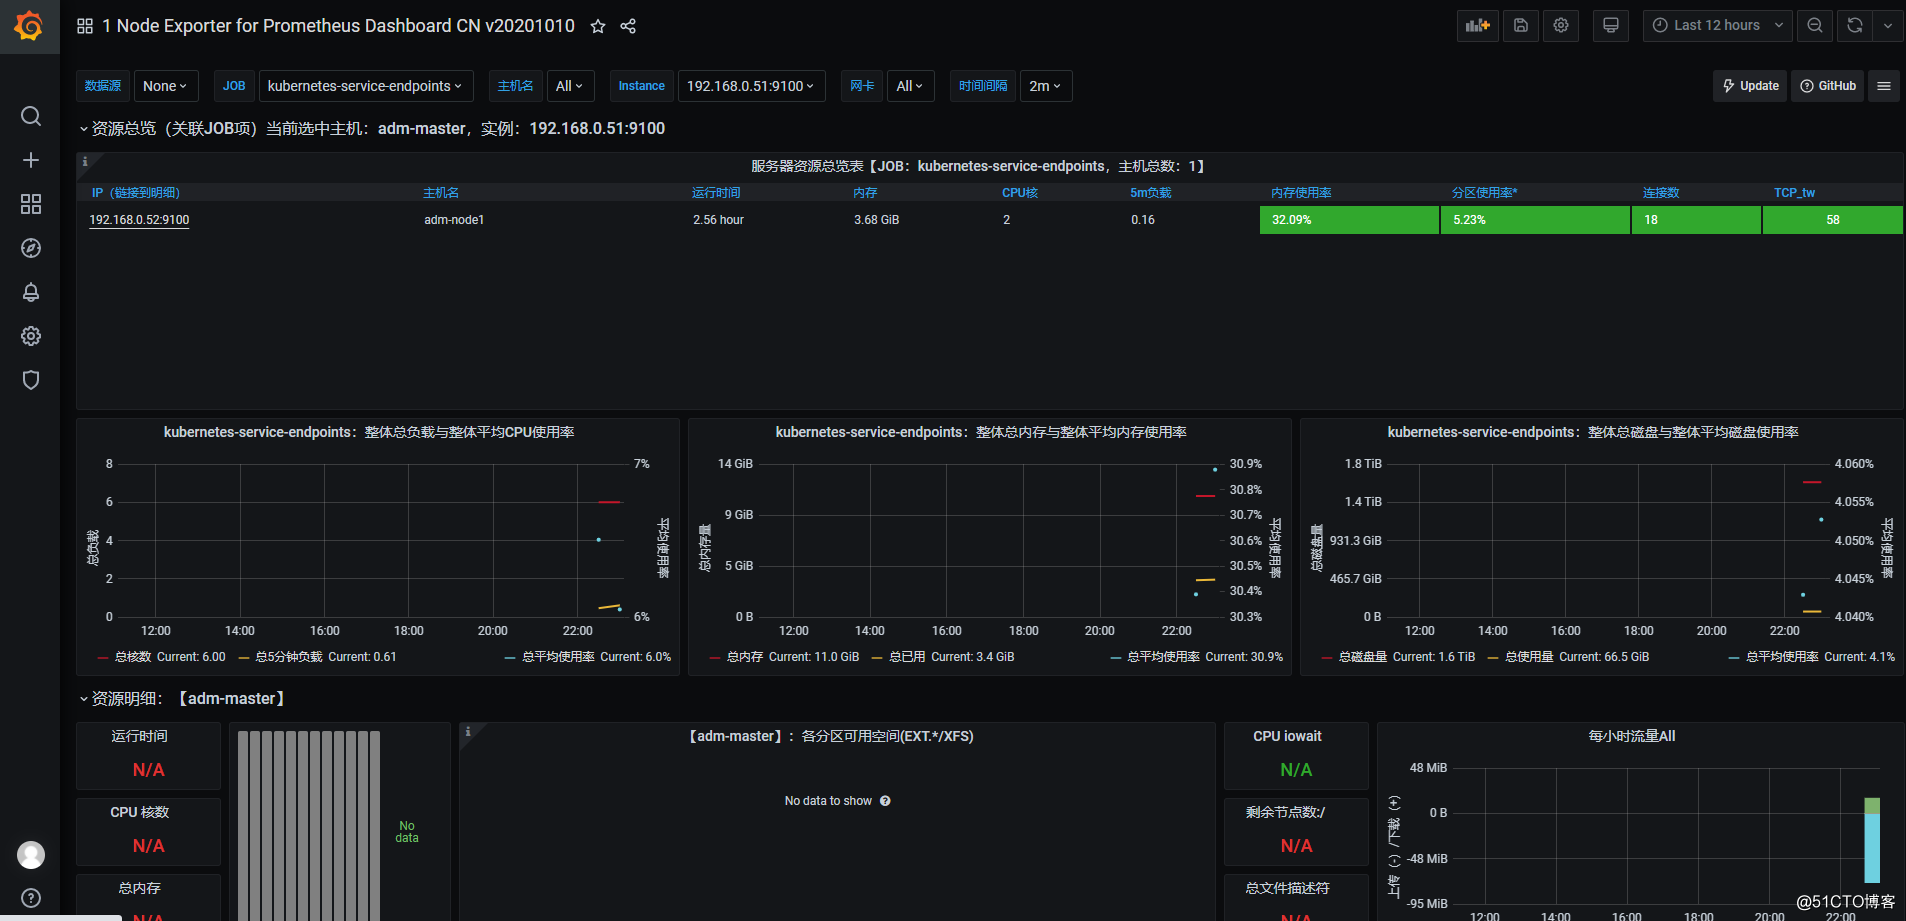
还可以尝试导入模板
Dashboards–Manage–import
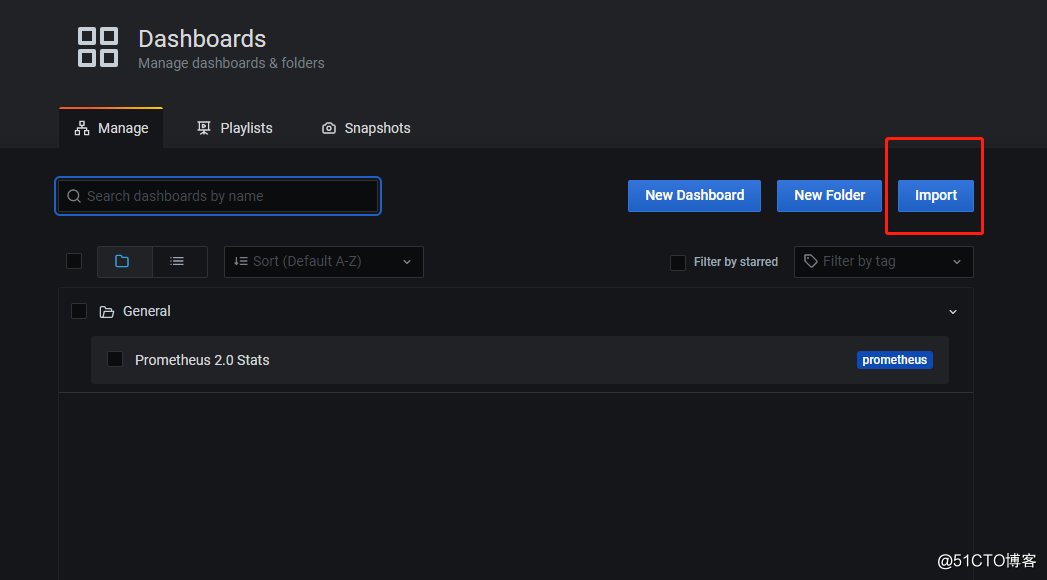
输入8919,点击load