Getting Started with the G1 Garbage Collector
Overview
Purpose
This tutorial covers the basics of how to use the G1 garbage collector and how it can be used with the Hotspot JVM. You will learn how the G1 collector functions internally, the key command line switches for using G1, and options for logging its operation.
Time to Complete
Approximately 1 hour
Introduction
This OBE covers the basics of Java Virtual Machine(JVM) G1 Garbage Collection (GC) in Java. In the first part of the OBE, an overview of the JVM is provided along with an introduction to Garbage Collection and performance. Next students are provided with a review of how the CMS collector works with the Hotspot JVM. Next, a step by step guide to how Garbage Collection works when using the G1 garbage collection with a Hotspot JVM. Following that, a section is provided covering the Garbage Collection command line options available with the G1 garbage collector. Finally, you will learn about logging options to use with the G1 collector.
Hardware and Software Requirements
The following is a list of hardware and software requirements:
Prerequisites
Before starting this tutorial, you should:
-
- A PC running Windows XP or later, Mac OS X or Linux. Note that the hands on is done with Windows 7 and has not been tested on all platforms. However, everything should work fine on OS X or Linux. Also a machine with more than one core is preferable.
- Java 7 Update 9 or later
- The latest Java 7 Demos and Samples Zip file
- If you have not done so, download and install the latest version of the Java JDK (JDK 7 u9 or later).
Java 7 JDK Downloads - Download and install the Demos and Samples zip file from the same location. Unzip the file and place the contents in a directory. For example:
C:\javademos
Java Technology and the JVM
Java Overview
Java is a programming language and computing platform first released by Sun Microsystems in 1995. It is the underlying technology that powers Java programs including utilities, games, and business applications. Java runs on more than 850 million personal computers worldwide, and on billions of devices worldwide, including mobile and TV devices. Java is composed of a number of key components that, as a whole, create the Java platform.
Java Runtime Edition
When you download Java, you get the Java Runtime Environment (JRE). The JRE consists of the Java Virtual Machine (JVM), Java platform core classes, and supporting Java platform libraries. All three are required to run Java applications on your computer. With Java 7, Java applications run as desktop applications from the operating system, as a desktop application but installed from the Web using Java Web Start, or as a Web Embedded application in a browser (using JavaFX).
Java Programming Language
Java is an object-oriented programming language that includes the following features.
- Platform Independence - Java applications are compiled into bytecode which is stored in class files and loaded in a JVM. Since applications run in a JVM, they can be run on many different operating systems and devices.
- Object-Oriented - Java is an object-oriented language that take many of the features of C and C++ and improves upon them.
- Automatic Garbage Collection - Java automatically allocates and deallocates memory so programs are not burdened with that task.
- Rich Standard Library - Java includes a vast number of premade objects that can be used to perform such tasks as input/output, networking, and date manipulation.
Java Development Kit
The Java Development Kit (JDK) is a collection of tools for developing Java applications. With the JDK, you can compile programs written in the Java Programming language and run them in a JVM. In addition, the JDK provides tools for packaging and distributing your applications.
The JDK and the JRE share the Java Application Programming Interfaces (Java API). The Java API is a collection of prepackaged libraries developers use to create Java applications. The Java API makes development easier by providing the tools to complete many common programming tasks including string manipulation, date/time processing, networking, and implementing data structures (e.g., lists, maps, stacks, and queues).
Java Virtual Machine
The Java Virtual Machine (JVM) is an abstract computing machine. The JVM is a program that looks like a machine to the programs written to execute in it. This way, Java programs are written to the same set of interfaces and libraries. Each JVM implementation for a specific operating system, translates the Java programming instructions into instructions and commands that run on the local operating system. This way, Java programs achieve platform independence.
The first prototype implementation of the Java virtual machine, done at Sun Microsystems, Inc., emulated the Java virtual machine instruction set in software hosted by a handheld device that resembled a contemporary Personal Digital Assistant (PDA). Oracle's current implementations emulate the Java virtual machine on mobile, desktop and server devices, but the Java virtual machine does not assume any particular implementation technology, host hardware, or host operating system. It is not inherently interpreted, but can just as well be implemented by compiling its instruction set to that of a silicon CPU. It may also be implemented in microcode or directly in silicon.
The Java virtual machine knows nothing of the Java programming language, only of a particular binary format, the class file format. A class file contains Java virtual machine instructions (or bytecodes) and a symbol table, as well as other ancillary information.
For the sake of security, the Java virtual machine imposes strong syntactic and structural constraints on the code in a class file. However, any language with functionality that can be expressed in terms of a valid class file can be hosted by the Java virtual machine. Attracted by a generally available, machine-independent platform, implementors of other languages can turn to the Java virtual machine as a delivery vehicle for their languages. (1) The Java Virtual Machine
Exploring the JVM Architecture
Hotspot Architecture
The HotSpot JVM possesses an architecture that supports a strong foundation of features and capabilities and supports the ability to realize high performance and massive scalability. For example, the HotSpot JVM JIT compilers generate dynamic optimizations. In other words, they make optimization decisions while the Java application is running and generate high-performing native machine instructions targeted for the underlying system architecture. In addition, through the maturing evolution and continuous engineering of its runtime environment and multithreaded garbage collector, the HotSpot JVM yields high scalability on even the largest available computer systems.

The main components of the JVM include the class loader, the runtime data areas, and the execution engine.
Key Hotspot Components
The key components of the JVM that relate to performance are highlighted in the following image.

There are three components of the JVM that are focused on when tuning performance. The heap is where your object data is stored. This area is then managed by the garbage collector selected at startup. Most tuning options relate to sizing the heap and choosing the most appropriate garbage collector for your situation. The JIT compiler also has a big impact on performance but rarely requires tuning with the newer versions of the JVM.
Performance Basics
Typically, when tuning a Java application, the focus is on one of two main goals: responsiveness or throughput. We will refer back to these concepts as the tutorial progresses.
Responsiveness
Responsiveness refers to how quickly an application or system responds with a requested piece of data. Examples include:
- How quickly a desktop UI responds to an event
- How fast a website returns a page
- How fast a database query is returned
For applications that focus on responsiveness, large pause times are not acceptable. The focus is on responding in short periods of time.
Throughput
Throughput focuses on maximizing the amount of work by an application in a specific period of time. Examples of how throughput might be measured include:
- The number of transactions completed in a given time.
- The number of jobs that a batch program can complete in an hour.
- The number of database queries that can be completed in an hour.
High pause times are acceptable for applications that focus on throughput. Since high throughput applications focus on benchmarks over longer periods of time, quick response time is not a consideration.
The G1 Garbage Collector
The G1 Garbage Collector
The Garbage-First (G1) collector is a server-style garbage collector, targeted for multi-processor machines with large memories. It meets garbage collection (GC) pause time goals with a high probability, while achieving high throughput. The G1 garbage collector is fully supported in Oracle JDK 7 update 4 and later releases. The G1 collector is designed for applications that:
G1 is planned as the long term replacement for the Concurrent Mark-Sweep Collector (CMS). Comparing G1 with CMS, there are differences that make G1 a better solution. One difference is that G1 is a compacting collector. G1 compacts sufficiently to completely avoid the use of fine-grained free lists for allocation, and instead relies on regions. This considerably simplifies parts of the collector, and mostly eliminates potential fragmentation issues. Also, G1 offers more predictable garbage collection pauses than the CMS collector, and allows users to specify desired pause targets.
G1 Operational Overview
The older garbage collectors (serial, parallel, CMS) all structure the heap into three sections: young generation, old generation, and permanent generation of a fixed memory size.

All memory objects end up in one of these three sections.
The G1 collector takes a different approach.

The heap is partitioned into a set of equal-sized heap regions, each a contiguous range of virtual memory. Certain region sets are assigned the same roles (eden, survivor, old) as in the older collectors, but there is not a fixed size for them. This provides greater flexibility in memory usage.
When performing garbage collections, G1 operates in a manner similar to the CMS collector. G1 performs a concurrent global marking phase to determine the liveness of objects throughout the heap. After the mark phase completes, G1 knows which regions are mostly empty. It collects in these regions first, which usually yields a large amount of free space. This is why this method of garbage collection is called Garbage-First. As the name suggests, G1 concentrates its collection and compaction activity on the areas of the heap that are likely to be full of reclaimable objects, that is, garbage. G1 uses a pause prediction model to meet a user-defined pause time target and selects the number of regions to collect based on the specified pause time target.
The regions identified by G1 as ripe for reclamation are garbage collected using evacuation. G1 copies objects from one or more regions of the heap to a single region on the heap, and in the process both compacts and frees up memory. This evacuation is performed in parallel on multi-processors, to decrease pause times and increase throughput. Thus, with each garbage collection, G1 continuously works to reduce fragmentation, working within the user defined pause times. This is beyond the capability of both the previous methods. CMS (Concurrent Mark Sweep ) garbage collector does not do compaction. ParallelOld garbage collection performs only whole-heap compaction, which results in considerable pause times.
It is important to note that G1 is not a real-time collector. It meets the set pause time target with high probability but not absolute certainty. Based on data from previous collections, G1 does an estimate of how many regions can be collected within the user specified target time. Thus, the collector has a reasonably accurate model of the cost of collecting the regions, and it uses this model to determine which and how many regions to collect while staying within the pause time target.
Note: G1 has both concurrent (runs along with application threads, e.g., refinement, marking, cleanup) and parallel (multi-threaded, e.g., stop the world) phases. Full garbage collections are still single threaded, but if tuned properly your applications should avoid full GCs.
G1 Footprint
If you migrate from the ParallelOldGC or CMS collector to G1, you will likely see a larger JVM process size. This is largely related to "accounting" data structures such as Remembered Sets and Collection Sets.
Remembered Sets or RSets track object references into a given region. There is one RSet per region in the heap. The RSet enables the parallel and independent collection of a region. The overall footprint impact of RSets is less than 5%.
Collection Sets or CSets the set of regions that will be collected in a GC. All live data in a CSet is evacuated (copied/moved) during a GC. Sets of regions can be Eden, survivor, and/or old generation. CSets have a less than 1% impact on the size of the JVM.
Recommended Use Cases for G1
The first focus of G1 is to provide a solution for users running applications that require large heaps with limited GC latency. This means heap sizes of around 6GB or larger, and stable and predictable pause time below 0.5 seconds.
Applications running today with either the CMS or the ParallelOldGC garbage collector would benefit switching to G1 if the application has one or more of the following traits.
Note: If you are using CMS or ParallelOldGC and your application is not experiencing long garbage collection pauses, it is fine to stay with your current collector. Changing to the G1 collector is not a requirement for using the latest JDK.
-
- Can operate concurrently with applications threads like the CMS collector.
- Compact free space without lengthy GC induced pause times.
- Need more predictable GC pause durations.
- Do not want to sacrifice a lot of throughput performance.
- Do not require a much larger Java heap.
- Full GC durations are too long or too frequent.
- The rate of object allocation rate or promotion varies significantly.
- Undesired long garbage collection or compaction pauses (longer than 0.5 to 1 second)
Reviewing GC with the CMS
Reviewing Generational GC and CMS
The Concurrent Mark Sweep (CMS) collector (also referred to as the concurrent low pause collector) collects the tenured generation. It attempts to minimize the pauses due to garbage collection by doing most of the garbage collection work concurrently with the application threads. Normally the concurrent low pause collector does not copy or compact the live objects. A garbage collection is done without moving the live objects. If fragmentation becomes a problem, allocate a larger heap.
Note: CMS collector on young generation uses the same algorithm as that of the parallel collector.
CMS Collection Phases
The CMS collector performs the following phases on the old generation of the heap:
| Phase | Description |
| (1) Initial Mark (Stop the World Event) |
Objects in old generation are “marked” as reachable including those objects which may be reachable from young generation. Pause times are typically short in duration relative to minor collection pause times. |
| (2) Concurrent Marking | Traverse the tenured generation object graph for reachable objects concurrently while Java application threads are executing. Starts scanning from marked objects and transitively marks all objects reachable from the roots. The mutators are executing during the concurrent phases 2, 3, and 5 and any objects allocated in the CMS generation during these phases (including promoted objects) are immediately marked as live. |
| (3) Remark (Stop the World Event) |
Finds objects that were missed by the concurrent mark phase due to updates by Java application threads to objects after the concurrent collector had finished tracing that object. |
| (4) Concurrent Sweep | Collects the objects identified as unreachable during marking phases. The collection of a dead object adds the space for the object to a free list for later allocation. Coalescing of dead objects may occur at this point. Note that live objects are not moved. |
| (5) Resetting | Prepare for next concurrent collection by clearing data structures. |
Reviewing Garbage Collection Steps
Next, let's review CMS Collector operations step by step.
Heap Structure for CMS Collector
The heap is split into three spaces.

Young generation is split into Eden and two survivor spaces. Old generation is one contiguous space. Object collection is done in place. No compaction is done unless there is a full GC.
How Young GC works in CMS
The young generation is colored light green and the old generation in blue. This is what the CMS might look like if your application has been running for a while. Objects are scattered around the old generation area.
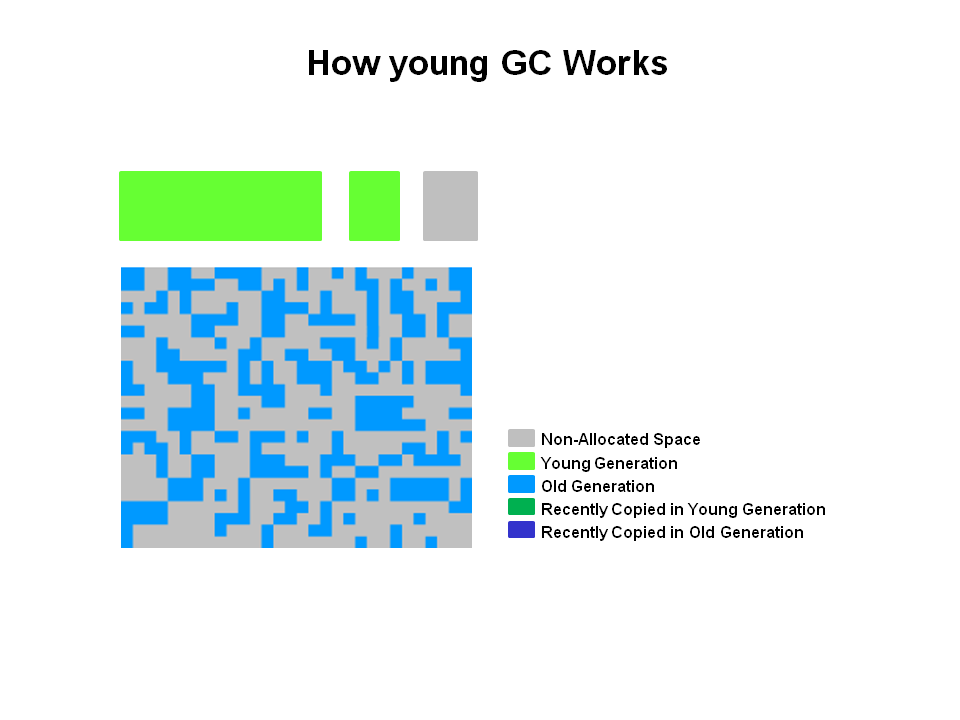
With CMS, old generation objects are deallocated in place. They are not moved around. The space is not compacted unless there is a full GC.
Young Generation Collection
Live objects are copied from the Eden space and survivor space to the other survivor space. Any older objects that have reached their aging threshold are promoted to old generation.

After Young GC
After a young GC, the Eden space is cleared and one of the survivor spaces is cleared.

Newly promoted objects are shown in dark blue on the diagram. The green objects are surviving young generation objects that have not yet been promoted to old generation.
Old Generation Collection with CMS
Two stop the world events take place: initial mark and remark. When the old generation reaches a certain occupancy rate, the CMS is kicked off.

(1) Initial mark is a short pause phase where live (reachable) objects are marked. (2) Concurrent marking finds live objects while the application continues to execute. Finally, in the (3) remark phase, objects are found that were missed during (2) concurrent marking in the previous phase.
Old Generation Collection - Concurrent Sweep
Objects that were not marked in the previous phase are deallocated in place. There is no compaction.

Note: Unmarked objects == Dead Objects
Old Generation Collection - After Sweeping
After the (4) Sweeping phase, you can see that a lot of memory has been freed up. You will also notice that no compaction has been done.

Finally, the CMS collector will move through the (5) resetting phase and wait for the next time the GC threshold is reached.
The G1 Garbage Collector Step by Step
The G1 Garbage Collector Step by Step
The G1 collector takes a different approach to allocating the heap. The pictures that follow review the G1 system step by step.
G1 Heap Structure
The heap is one memory area split into many fixed sized regions.

Region size is chosen by the JVM at startup. The JVM generally targets around 2000 regions varying in size from 1 to 32Mb.
G1 Heap Allocation
In reality, these regions are mapped into logical representations of Eden, Survivor, and old generation spaces.
The colors in the picture shows which region is associated with which role. Live objects are evacuated (i.e., copied or moved) from one region to another. Regions are designed to be collected in parallel with or without stopping all other application threads.
As shown regions can be allocated into Eden, survivor, and old generation regions. In addition, there is a fourth type of object known as Humongous regions. These regions are designed to hold objects that are 50% the size of a standard region or larger. They are stored as a set of contiguous regions. Finally the last type of regions would be the unused areas of the heap.
Note: At the time of this writing, collecting humongous objects has not been optimized. Therefore, you should avoid creating objects of this size.
Young Generation in G1
The heap is split into approximately 2000 regions. Minimum size is 1Mb and maximum size is 32Mb. Blue regions hold old generation objects and green regions hold young generation objects.

Note that the regions are not required to be contiguous like the older garbage collectors.
A Young GC in G1
Live objects are evacuated (i.e., copied or moved) to one or more survivor regions. If the aging threshold is met, some of the objects are promoted to old generation regions.

This is a stop the world (STW) pause. Eden size and survivor size is calculated for the next young GC. Accounting information is kept to help calculate the size. Things like the pause time goal are taken into consideration.
This approach makes it very easy to resize regions, making them bigger or smaller as needed.
End of a Young GC with G1
Live objects have been evacuated to survivor regions or to old generation regions.

Recently promoted objects are shown in dark blue. Survivor regions in green.
In summary, the following can be said about the young generation in G1:
- The heap is a single memory space split into regions.
- Young generation memory is composed of a set of non-contiguous regions. This makes it easy to resize when needed.
- Young generation garbage collections, or young GCs, are stop the world events. All application threads are stopped for the operation.
- The young GC is done in parallel using multiple threads.
- Live objects are copied to new survivor or old generation regions.
Old Generation Collection with G1
Like the CMS collector, the G1 collector is designed to be a low pause collector for old generation objects. The following table describes the G1 collection phases on old generation.
G1 Collection Phases - Concurrent Marking Cycle Phases
The G1 collector performs the following phases on the old generation of the heap. Note that some phases are part of a young generation collection.
| Phase | Description |
| (1) Initial Mark (Stop the World Event) |
This is a stop the world event. With G1, it is piggybacked on a normal young GC. Mark survivor regions (root regions) which may have references to objects in old generation. |
| (2) Root Region Scanning | Scan survivor regions for references into the old generation. This happens while the application continues to run. The phase must be completed before a young GC can occur. |
| (3) Concurrent Marking | Find live objects over the entire heap. This happens while the application is running. This phase can be interrupted by young generation garbage collections. |
| (4) Remark (Stop the World Event) |
Completes the marking of live object in the heap. Uses an algorithm called snapshot-at-the-beginning (SATB) which is much faster than what was used in the CMS collector. |
| (5) Cleanup (Stop the World Event and Concurrent) |
|
| (*) Copying (Stop the World Event) |
These are the stop the world pauses to evacuate or copy live objects to new unused regions. This can be done with young generation regions which are logged as [GC pause (young)]. Or both young and old generation regions which are logged as [GC Pause (mixed)]. |
G1 Old Generation Collection Step by Step
With the phases defined, let's look at how they interact with the old generation in the G1 collector.
Initial Marking Phase
Initial marking of live object is piggybacked on a young generation garbage collection. In the logs this is noted as GC pause (young)(inital-mark).

Concurrent Marking Phase
If empty regions are found (as denoted by the "X"), they are removed immediately in the Remark phase. Also, "accounting" information that determines liveness is calculated.

Remark Phase
Empty regions are removed and reclaimed. Region liveness is now calculated for all regions.

Copying/Cleanup Phase
G1 selects the regions with the lowest "liveness", those regions which can be collected the fastest. Then those regions are collected at the same time as a young GC. This is denoted in the logs as [GC pause (mixed)]. So both young and old generations are collected at the same time.

After Copying/Cleanup Phase
The regions selected have been collected and compacted into the dark blue region and the dark green region shown in the diagram.

Summary of Old Generation GC
In summary, there are a few key points we can make about the G1 garbage collection on the old generation.
-
- Concurrent Marking Phase
- Liveness information is calculated concurrently while the application is running.
- This liveness information identifies which regions will be best to reclaim during an evacuation pause.
- There is no sweeping phase like in CMS.
- Remark Phase
- Uses the Snapshot-at-the-Beginning (SATB) algorithm which is much faster then what was used with CMS.
- Completely empty regions are reclaimed.
- Copying/Cleanup Phase
- Young generation and old generation are reclaimed at the same time.
- Old generation regions are selected based on their liveness.
- Concurrent Marking Phase
Command Line Options and Best Practices
Command Line Options and Best Practices
In this section let's take a look at the various command line options for G1.
Basic Command Line
To enable the G1 Collector use: -XX:+UseG1GC
Here is a sample command line for starting the Java2Demo included in the JDK demos and samples download:java -Xmx50m -Xms50m -XX:+UseG1GC -XX:MaxGCPauseMillis=200 -jar c:\javademos\demo\jfc\Java2D\Java2demo.jar
Key Command Line Switches
-XX:+UseG1GC - Tells the JVM to use the G1 Garbage collector.
-XX:MaxGCPauseMillis=200 - Sets a target for the maximum GC pause time. This is a soft goal, and the JVM will make its best effort to achieve it. Therefore, the pause time goal will sometimes not be met. The default value is 200 milliseconds.
-XX:InitiatingHeapOccupancyPercent=45 - Percentage of the (entire) heap occupancy to start a concurrent GC cycle. It is used by G1 to trigger a concurrent GC cycle based on the occupancy of the entire heap, not just one of the generations. A value of 0 denotes 'do constant GC cycles'. The default value is 45 (i.e., 45% full or occupied).
Best Practices
There are a few best practices you should follow when using G1.
Do not Set Young Generation Size
Explicitly setting young generation size via -Xmn meddles with the default behavior of the G1 collector.
Response Time Metrics
Instead of using average response time (ART) as a metric to set the XX:MaxGCPauseMillis=<N>, consider setting value that will meet the goal 90% of the time or more. This means 90% of users making a request will not experience a response time higher than the goal. Remember, the pause time is a goal and is not guaranteed to always be met.
What is an Evacuation Failure?
A promotion failure that happens when a JVM runs out of heap regions during the GC for either survivors and promoted objects. The heap can't expand because it is already at max. This is indicated in the GC logs when using -XX:+PrintGCDetails by to-space overflow. This is expensive!
How to avoid Evacuation Failure
To avoid evacuation failure, consider the following options.
Complete List of G1 GC Switches
This is the complete list of G1 GC switches. Remember to use the best practices outlined above.
| Option and Default Value | Description |
|---|---|
| -XX:+UseG1GC | Use the Garbage First (G1) Collector |
| -XX:MaxGCPauseMillis=n | Sets a target for the maximum GC pause time. This is a soft goal, and the JVM will make its best effort to achieve it. |
| -XX:InitiatingHeapOccupancyPercent=n | Percentage of the (entire) heap occupancy to start a concurrent GC cycle. It is used by GCs that trigger a concurrent GC cycle based on the occupancy of the entire heap, not just one of the generations (e.g., G1). A value of 0 denotes 'do constant GC cycles'. The default value is 45. |
| -XX:NewRatio=n | Ratio of new/old generation sizes. The default value is 2. |
| -XX:SurvivorRatio=n | Ratio of eden/survivor space size. The default value is 8. |
| -XX:MaxTenuringThreshold=n | Maximum value for tenuring threshold. The default value is 15. |
| -XX:ParallelGCThreads=n | Sets the number of threads used during parallel phases of the garbage collectors. The default value varies with the platform on which the JVM is running. |
| -XX:ConcGCThreads=n | Number of threads concurrent garbage collectors will use. The default value varies with the platform on which the JVM is running. |
| -XX:G1ReservePercent=n | Sets the amount of heap that is reserved as a false ceiling to reduce the possibility of promotion failure. The default value is 10. |
| -XX:G1HeapRegionSize=n | With G1 the Java heap is subdivided into uniformly sized regions. This sets the size of the individual sub-divisions. The default value of this parameter is determined ergonomically based upon heap size. The minimum value is 1Mb and the maximum value is 32Mb. |
-
- G1 will no longer respect the pause time target for collections. So in essence, setting the young generation size disables the pause time goal.
- G1 is no longer able to expand and contract the young generation space as needed. Since the size is fixed, no changes can be made to the size.
- GC still has to continue so space has to be freed up.
- Unsuccessfully copied objects have to be tenured in place.
- Any updates to RSets of regions in the CSet have to be regenerated.
- All of these steps are expensive.
- Increase heap size
- Increase the
-XX:G1ReservePercent=n, the default is 10. - G1 creates a false ceiling by trying to leave the reserve memory free in case more 'to-space' is desired.
- Increase the
- Start the marking cycle earlier
- Increase the number of marking threads using the
-XX:ConcGCThreads=noption.
Logging GC with G1
Logging GC with G1
The final topic we need to cover is using logging information to analyze performance with the G1 collector. This section provides a quick overview of the switches you can use to collect data and the information that is printed in the logs.
Setting the Log Detail
You can set the detail to three different levels of detail.
(1) -verbosegc (which is equivalent to -XX:+PrintGC) sets the detail level of the log to fine.
Sample Output
[GC pause (G1 Humongous Allocation) (young) (initial-mark) 24M- >21M(64M), 0.2349730 secs]
[GC pause (G1 Evacuation Pause) (mixed) 66M->21M(236M), 0.1625268 secs]
(2) -XX:+PrintGCDetails sets the detail level to finer. The options shows the following information:
Sample Output
[Ext Root Scanning (ms): Avg: 1.7 Min: 0.0 Max: 3.7 Diff: 3.7]
[Eden: 818M(818M)->0B(714M) Survivors: 0B->104M Heap: 836M(4096M)->409M(4096M)]
(3) -XX:+UnlockExperimentalVMOptions -XX:G1LogLevel=finest sets the detail level to its finest. Like finer but includes individual worker thread information.
[Ext Root Scanning (ms): 2.1 2.4 2.0 0.0
           Avg: 1.6 Min: 0.0 Max: 2.4 Diff: 2.3]
       [Update RS (ms):  0.4  0.2  0.4  0.0
           Avg: 0.2 Min: 0.0 Max: 0.4 Diff: 0.4]
           [Processed Buffers : 5 1 10 0
           Sum: 16, Avg: 4, Min: 0, Max: 10, Diff: 10]
Determining Time
A couple of switches determine how time is displayed in the GC log.
(1) -XX:+PrintGCTimeStamps - Shows the elapsed time since the JVM started.
Sample Output
1.729: [GC pause (young) 46M->35M(1332M), 0.0310029 secs]
(2) -XX:+PrintGCDateStamps - Adds a time of day prefix to each entry.
2012-05-02T11:16:32.057+0200: [GC pause (young) 46M->35M(1332M), 0.0317225 secs]
Understanding G1 Log
To understand the log, this section defines a number of terms using actual GC log output. The following examples show output from the log with explanations of the terms and values you will find in it.
Note: For more information check out Poonam Bajaj's Blog post on G1 GC logs.
G1 Logging Terms Index
Clear CT
CSet
External Root Scanning
Free CSet
GC Worker End
GC Worker Other
Object Copy
Other
Parallel Time
Ref Eng
Ref Proc
Scanning Remembered Sets
Termination Time
Update Remembered Set
Worker Start
Parallel Time
414.557: [GC pause (young), 0.03039600 secs] [Parallel Time: 22.9 ms]
[GC Worker Start (ms): 7096.0 7096.0 7096.1 7096.1 706.1 7096.1 7096.1 7096.1 7096.2 7096.2 7096.2 7096.2
       Avg: 7096.1, Min: 7096.0, Max: 7096.2, Diff: 0.2]
Parallel Time – Overall elapsed time of the main parallel part of the pause
Worker Start – Timestamp at which the workers start
Note: The logs are ordered on thread id and are consistent on each entry
External Root Scanning
[Ext Root Scanning (ms): 3.1 3.4 3.4 3.0 4.2 2.0 3.6 3.2 3.4 7.7 3.7 4.4
     Avg: 3.8, Min: 2.0, Max: 7.7, Diff: 5.7]
External root scanning - The time taken to scan the external root (e.g., things like system dictionary that point into the heap.)
Update Remembered Set
[Update RS (ms): 0.1 0.0 0.0 0.0 0.0 0.0 0.0 0.0 0.0 0.0 0.0 0.0 Avg: 0.0, Min: 0.0, Max: 0.1, Diff: 0.1]
   [Processed Buffers : 26 0 0 0 0 0 0 0 0 0 0 0
    Sum: 26, Avg: 2, Min: 0, Max: 26, Diff: 26]
Update Remembered Set - Any buffers that are completed but have not yet been processed by the concurrent refinement thread before the start of the pause have to be updated. Time depends on density of the cards. The more cards, the longer it will take.
Scanning Remembered Sets
[Scan RS (ms): 0.4 0.2 0.1 0.3 0.0 0.0 0.1 0.2 0.0 0.1 0.0 0.0 Avg: 0.1, Min: 0.0, Max: 0.4, Diff: 0.3]F
Scanning Remembered Sets - Look for pointers that point into the Collection Set.
Object Copy
[Object Copy (ms): 16.7 16.7 16.7 16.9 16.0 18.1 16.5 16.8 16.7 12.3 16.4 15.7 Avg: 16.3, Min: 12.3, Max: 18.1, Diff: 5.8]
Object copy – The time that each individual thread spent copying and evacuating objects.
Termination Time
[Termination (ms): 0.0 0.0 0.0 0.0 0.0 0.0 0.0 0.0 0.0 0.0 0.0
0.0 Avg: 0.0, Min: 0.0, Max: 0.0, Diff: 0.0] [Termination Attempts : 1 1 1 1 1 1 1 1 1 1 1 1 Sum: 12, Avg: 1, Min: 1, Max: 1, Diff: 0]
Termination time - When a worker thread is finished with its particular set of objects to copy and scan, it enters the termination protocol. It looks for work to steal and once it's done with that work it again enters the termination protocol. Termination attempt counts all the attempts to steal work.
GC Worker End
[GC Worker End (ms): 7116.4 7116.3 7116.4 7116.3 7116.4 7116.3 7116.4 7116.4 7116.4 7116.4 7116.3 7116.3
    Avg: 7116.4, Min: 7116.3, Max: 7116.4, Diff:   0.1]
[GC Worker (ms): 20.4 20.3 20.3 20.2 20.3 20.2 20.2 20.2 20.3 20.2 20.1 20.1
     Avg: 20.2, Min: 20.1, Max: 20.4, Diff: 0.3]
GC worker end time – Timestamp when the individual GC worker stops.
GC worker time – Time taken by individual GC worker thread.
GC Worker Other
[GC Worker Other (ms): 2.6 2.6 2.7 2.7 2.7 2.7 2.7 2.8 2.8 2.8 2.8 2.8
    Avg: 2.7, Min: 2.6, Max: 2.8, Diff: 0.2]
GC worker other – The time (for each GC thread) that can't be attributed to the worker phases listed previously. Should be quite low. In the past, we have seen excessively high values and they have been attributed to bottlenecks in other parts of the JVM (e.g., increases in the Code Cache occupancy with Tiered).
Clear CT
[Clear CT: 0.6 ms]
Time taken to clear the card table of RSet scanning meta-data
Other
[Other: 6.8 ms]
Time taken for various other sequential phases of the GC pause.
CSet
[Choose CSet: 0.1 ms]
Time taken finalizing the set of regions to collect. Usually very small; slightly longer when having to select old.
Ref Proc
[Ref Proc: 4.4 ms]
Time spent processing soft, weak, etc. references deferred from the prior phases of the GC.
Ref Enq
[Ref Enq: 0.1 ms]
Time spent placing soft, weak, etc. references on to the pending list.
Free CSet
[Free CSet: 2.0 ms]
Time spent freeing the set of regions that have just been collected, including their remembered sets.
-
- Average, Min, and Max time are displayed for each phase.
- Root Scan, RSet Updating (with processed buffers information), RSet Scan, Object Copy, Termination (with number of attempts).
- Also shows “other” time such as time spent choosing CSet, reference processing, reference enqueuing and freeing CSet.
- Shows the Eden, Survivors and Total Heap occupancies.
Summary
In this OBE, you have been given an overview of the G1 garbage collector included in the Java JVM. First you learned how the Heap and the Garbage Collector are key parts of any Java JVM. Next your reviewed how garbage collection works using the CMS collector and the G1 collector. Next you learned about the G1 command line switches and the best practices for using them. Finally, you learned about logging object and data included in the GC logs.
In this tutorial, you have learned:
Resources
For more information and related information please see these site and links.
Credits
-
- The components of the Java JVM
- An overview of the G1 Collector
- A review of the CMS collector
- A review of the G1 collector
- Command line switches and best practices
- Logging with G1
- Java HotSpot VM Options
- The Garbage First(G1) Garbage Collector
- Poonam Bajaj G1 GC Blog Post
- Java SE 7: Develop Rich Client Applications
- Java Performance - Charlie Hunt and Binu John
- Oracle Learning Library
- Curriculum Developer: Michael J Williams
- QA: Krishnanjani Chitta