目录
- 1. MSCA(Mobile Supply Chain Application)日志的收集
- 2. Inventory模块日志的收集
- 3. Order Management模块日志收集方法
- 4. Shipping模块日志收集方法
- 5. WIP模块日志收集方法
- 6. Oracle EBS RCV模块日志收集方法
- 7. Debug log of Cost Management
- 8. How to generate an GL debug log file
- 9. How to generate an AR debug log file
- 10. How to generate an AP debug log file
- 11. EBS FRD(Forms Runtime Diagnostics) Log的收集方法
- 12. Oracle EBS SQL Trace日志收集的方法
1. MSCA(Mobile Supply Chain Application)日志的收集
Reference Note:338291.1 - Howto Enable WMS / MSCA Logging
- Locate the mwa.cfg file:
In 11i: $MWA_TOP/secure/
In R12: $INST_TOP/admin/install/ - Ensure trace is enabled in the mwa.cfg file.
You should see trace level: mwa.LogLevel=TRACE
Also check for ‘mwa.logdir’ to be set accordingly(为日志输出路径,R12下,mobile日志会写到$INST_TOP/logs下)
注:mwa.LogLevel可以设置为: Fatal, Error, Warning, Debug, and Trace.
Fatal只有在出现错误的情况才会记录日志. Trace会打出所有日志。因为性能原因,一般情况下不要设置logLevel到TRACE - Restart the mobile server and hit ctrl-X, see what directory is for the logging
- After you perform the transaction again, get the following log files from that log directory
[port].INV.log
[port].system.log
2. Inventory模块日志的收集
Reference Note:148651.1 - INV DEBUG: How to get Debug Information for Inventory
Set the System Profile Values as follows:
SYSTEM PROFILE VALUES
– Summary
- INV: Debug Trace: Yes
- INV:Debug Level: 11
- INV: Debug file: /usr/tmp/invdebug.log
– Details
INV: Debug Trace: set Yes to turn on the debug functionality.
set No to turn off the debug functionality.
INV:Debug Level: set 0 , will print the summary debug messages.
set 10 , to print the detail debug messages.
INV: Debug file (Including the complete path):
The path is one of the directories from the valid
directories defined in the obtained v$parameter
through the following sql :
select value from v$parameter where name = 'utl_file_dir';
Make sure to include the file name at the end of the
path, e.g. ‘/<…>/trx_mgr.log’
如果Profile ‘TP:INV Transaction processing mode’ 设置成Background,那么debug messages就会输出到system request log file,可以通过View > Requests来查看debug log。
如果Profile ‘TP:INV Transaction processing mode’ 为Online, 则debug log会输出到用户指定文件(INV: Debug file)内。
补充:INV debug的日志实际上就是通过DB的utl_file.put_line来把日志写到文件中去的。
3. Order Management模块日志收集方法
Reference (NOTE:121054.1):How to generate a debug file in OM
OM: Debug = 5
OM: Debug Log Directory = <first directory path returned by
select value from v$parameter where name = ‘utl_file_dir’;
The User must have write privilege to this directory>
Log off and log back in the application for the profile settings to take place.
打开调试
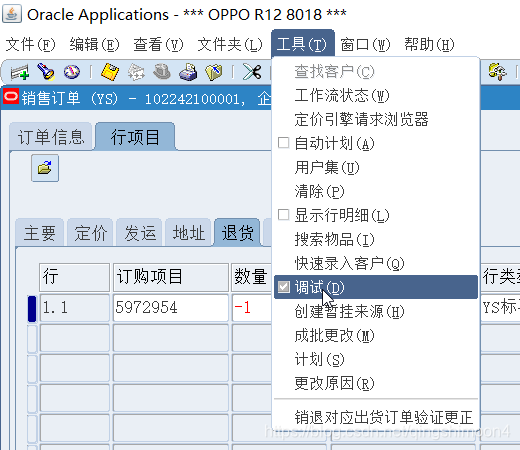
4. Shipping模块日志收集方法
Reference Note:290432.1 - How to Create a Debug File in Shipping Execution
A. To generate a debug file from the Shipping Transaction or Quick Ship forms
-
Set the following profile options:
OM: Debug Level - set to 5
WSH: Debug Enabled - set to Yes
WSH: Debug Level - set to Statement
WSH: Debug Log Directory - any directory that can be written to by the database
To check, run the following SQL statement:
Code:
select value from v$parameter where name = 'utl_file_dir'
Set profile option WSH: Debug Log Directory at the Site & Application Level. -
In the Shipping form go to Tools and check the Debug box. This will print out a file name - NOTE down this file name.
-
Perform the action you wish to debug.
-
Go to Tools and uncheck Debug.
-
After you have completed generating the debug file, please set thevalue of the profile OM: Debug Level back to 0 and WSH: Debug Enabledset to No, otherwise there will be some performance impact. Retrievethe debug file from the directory specified in step 1.
B. To generate debug information for Pick Release :
- Set the following profile options:
OM: Debug Level - set to 5
INV: Debug Trace - set to Yes
INV: Debug Level - set to 11
FND: Debug Log Enabled - set to Yes
FND: Debug Log Level - set to Statement
FND: Debug Log Module = set to wms.plsql.%
WSH: Debug Enabled - set to Yes
WSH: Debug Level - set to Statement - In the Release Sales Order for Picking form go to Tools and check the Debug box.
- Submit the pick release.
- Provide the Pick Selection List Generation log file.
C. To generate debug information for Interface Trip Stop - SRS:
- Set the following profile options:
OM: Debug Level - set to 5
INV: Debug Level - set to 10
WSH: Debug Enabled - set to Yes
WSH: Debug Level - set to Statement - Set the Debug Level parameter to 1 (Debugging ON) .
- Submit the job.
- Provide the log file.
D. To generate debug information for an APIs:
- Set the following profile options:
OM: Debug Level - set to 5
INV: Debug Level - set to 10
WSH: Debug Enabled - set to Yes
WSH: Debug Level - set to Statement
WSH: Debug Log Directory - set to a valid writeable directory path - Add the following line of code in the wrapper script which calls the API:
Code:DECLARE l_file_name VARCHAR2(32767); l_return_status VARCHAR2(32767); l_msg_data VARCHAR2(32767); l_msg_count NUMBER; BEGIN fnd_profile.put('WSH_DEBUG_MODULE','%'); fnd_profile.put('WSH_DEBUG_LEVEL',WSH_DEBUG_SV.C_STMT_LEVEL); wsh_debug_sv.start_debugger(l_file_name,l_return_status,l_msg_data,l_msg_count);
- Submit the job.
- Provide the log file.
5. WIP模块日志收集方法
How to generate WIP debug log files in ONLINE cases?
For 11.5.10 and above, the WIP debug log files will be created if
1. FND: Debug Log Filename = (Make sure this is null)
2. FND: Debug Log Enabled = Yes
3. FND: Debug Log Level = Statement
4. FND: Debug Log Module = WIP%
To get the log file, run the following SQL script. This will create an output called MoveON.txt
set pagesize 500
  col message_text format a99
  spool MoveON.txt
  select message_text  from fnd_log_messages where audsid=&audsid order by log_sequence;
spool off
To get the audsid In online cases
Navigate to Help > About Oracle applications
Note AUDSID Under Database Server and use it in the above sql.
To get the log messages for mobile applications
1. Get the maximum log sequence number using the following sql just before performing the test case and make a note of it.
select Max(log_sequence) from fnd_log_messages;
2. To get the log file,run the following SQL script.
  set pagesize 500
  col message_text format a99
  spool log.txt
select message_text from fnd_log_messages where log_sequence > &log_sequence;
Use the log_sequence number which is obtained from the point 1.
Note: For 11.5.9 and prior, there will be NO WIP debug log files generated for online cases.
How to generate WIP log files in BACKGROUND cases?
For 11.5.10 and above, the WIP debug log files will be created if
1. FND: Debug Log Filename = (Make sure this is null)
2. FND: Debug Log Enabled= Yes
3. FND: Debug Log Level = Statement
4. FND: Debug Log Module = WIP%
To get the log file, run the following SQL script. This will create an output called MoveBG.txt
   set pagesize 500
   col message_text format a99
   spool MoveBG.txt
   select message_text from fnd_log_messages
    where audsid=(select oracle_session_id from fnd_concurrent_requests
                    where  request_id = &Concurrent_Request_Id)
   order by log_sequence;
   spool off
For 11.5.9 and prior, the WIP debug log files will be created if
1. TP: WIP Concurrent Message Level = Message Level 2
2. TP: WIP Debug Directory = “valid directory from v$parameter”
You can use the following query to find out a valid directory.
select value from v$parameter where name=utl_file_dir;
3. TP:WIP Debug File = “valid filename”
4. MRP: Debug Mode = Yes
6. Oracle EBS RCV模块日志收集方法
Collecting RCV Debug files & logs in IMMEDIATE mode
-
Set the following profiles at the user level before proceeding further.
Profile Value Comments
RCV:Debug Mode Yes
RCV:Processing mode Immediate
PO:Enable Sql Trace for Receiving Processor Yes
FND:Log Enabled Yes
FND:Log Level Statement
FND:Log Module po% In small case
INV:Debug Level 11
INV:Debug Trace Yes
INV:Debug file utl_file_dir/newfilename To get utl_file_dir, use the following sql :
select value from v$parameter where name ='utl_file_dir'; -
Bounce the mobile port if the transaction is done thru mobile. Logout and relogin to the application.
-
Perform the problematic transaction.
=> Note down the concurrent request id of the Receiving Transaction Processor that gets launched. -
Once RTP completes, get the o/p of the following in .xls format.
select module, to_char(timestamp,'DD-MON-YYYY HH24:MI:SS'), message_text
  from fnd_log_messages
 where timestamp > sysdate - 2/24
   and process_id = ( select os_process_id
                      from fnd_concurrent_requests
                     where request_id = &request_id)
   and module like 'po%'
Pass the concurrent request_id from step 3.
-
Sql trace file will get generated under udump folder.
Use the following sql to get the udump path.
SELECT value FROM v$parameter WHERE name =‘user_dump_dest’ ;select oracle_process_id from fnd_concurrent_requests
where request_id = &p_request_id
Pass the concurrent request_id from step 3.Now search for the file names < output of previous query > under the udump folder.
-
Other files to be uploaded:
a) Inv log file.
b) rcv11i o/p.
c) Appscheck for PO & INV
Collecting RCV Debug files & logs in BATCH mode
- Set the following profiles at the user level before proceeding further.
| Profile | Value | Comments |
|---|---|---|
|
Profile
|
Value |
Comments
|
|
RCV:Debug Mode
|
Yes | |
|
RCV:Processing mode
|
Batch | |
|
PO:Enable Sql Trace for Receiving Processor
|
Yes | |
|
FND:Log Enabled
|
Yes | |
|
FND:Log Level
|
Statement | |
|
FND:Log Module
|
po% |
In small case
|
|
INV:Debug Level
|
11 | |
|
INV:Debug Trace
|
Yes | |
|
INV:Debug file
|
utl_file_dir/newfilename
|
To get utl_file_dir, use the following sql :select value from v$parameter where name =‘utl_file_dir’;
|
-
Bounce the mobile port if the transaction is done thru mobile. Logout and relogin to the application.
-
Get the dumps of rcv_headers_interface & rcv_Transactions_interface for the transaction before running the Receiving Transaction Processor (RTP)
Please give the output in .xls format, say rti_before_rtp.xls & rhi_before_rtp.xls
=> Note down the group_id. -
Run ‘Receiving Transaction Processor’ by passing the group_id from step 3.
=> Note down the concurrent request id of the Receiving Transaction Processor that gets launched. -
Once RTP completes, get the o/p of the following in .xls format.
 select module, to_char(timestamp,'DD-MON-YYYY HH24:MI:SS'), message_text
 from fnd_log_messages
 where timestamp > sysdate - 2/24
 and process_id = ( select os_process_id
                     from fnd_concurrent_requests
                    where request_id = &request_id)
 and module like 'po%'
Pass the concurrent request_id from step 4.
-
Get the dumps of rcv_headers_interface & rcv_Transactions_interface transaction after RTP run.
Please give the output in .xls format, say rti_after_rtp.xls & rhi_after_rtp.xls -
Sql trace file will get generated under udump folder.
Use the following sql to get the udump path.
SELECT value FROM v$parameter WHERE name ='user_dump_dest' ;

select oracle_process_id from fnd_concurrent_requests
where request_id = &p_request_id;
Pass the concurrent request_id from step 4.
Now search for the file names < output of previous query > under the udump folder. -
Other files to be uploaded:
a) Inv log file.
b) rcv11i o/p.
c) Appscheck for PO & INV
Collecting RCV Debug files & logs in ONLINE mode
- Set the following profiles at the user level before proceeding further.
| Profile | Value | Comments |
|---|---|---|
|
RCV:Debug Mode
|
Yes
|
|
|
RCV:Processing mode
|
Online
|
|
|
FND:Log Enabled
|
Yes
|
|
|
FND:Log Level
|
Statement
|
|
|
FND:Log Module
|
po% In small case
|
|
|
INV:RPC Time Out
|
1000
|
|
|
INV:Debug Level
|
11
|
|
|
INV:Debug Trace
|
Yes
|
|
|
INV:Debug file
|
utl_file_dir/newfilename
|
To get utl_file_dir, use the following sql :
select value from v$parameter where name ='utl_file_dir';
|
|
Initialization SQL Statement - Custom
|
Begin fnd_ctl.fnd_sess_ctl('','','TRUE','TRUE','LOG','ALTER SESSION SETTRACEFILE_IDENTIFIER='||''''||'123456'||''''||' EVENTS='||''''||'10046TRACE NAME CONTEXT FOREVER, LEVEL 12'||'''');End;
|
Pls type the above in a single line
|
-
Bounce the mobile port if the transaction is done thru mobile. Logout and relogin to the application.
-
Run SELECT MAX(LOG_SEQUENCE) FROM FND_LOG_MESSAGES;
=> Note down this value : value 1
4.Perform the transaction that is failing. Wait till you get the error message.
-
Run SELECT MAX(LOG_SEQUENCE) FROM FND_LOG_MESSAGES;
=> Note down this value : value 2 -
Pls get the o/p of the following query in .xls format
select module, to_char(timestamp,'DD-MON-YYYY HH24:MI:SS'), message_text from fnd_log_messages where log_sequence between < value1 > and < value2 > ; -
Sql trace file will get generated under udump folder.
Use the following sql to get the udump path.
SELECT value FROM v$parameter WHERE name ='user_dump_dest' ;Nowsearch in this udump folder for all files having the string ‘123456’ inthe file name & upload all such files.
-
Other files to be uploaded:
a) Inv log file.
b) rcv11i o/p.
c) Appscheck for PO & INV
7. Debug log of Cost Management
- Make sure to set the following profile options
- MRP:Debug Mode = yes
- MRP:Trace Mode = yes
- CST: Cost update debug level = Full
-
Resubmit the error transactions for costing.
Uncosted/Failed transactions can be resubmitted through application itself.
Costs -> View Transactions -> Material Transactions.
From the menu, Tools Select All: Tools Submit All
Else, can use the following script to submit the records in MMT table:update mtl_material_transactions set costed_flag = 'N', error_code = NULL, error_explanation = NULL, transaction_group_id = NULL, transaction_set_id = NULL where organization_id = &organization_id and costed_flag in ('N','E'); commit; -
Obtain the log file of the Cost Worker.
=Profile Details=
CST: Cost Update Debug Level
Indicates none or the level and type of debug messages to print in the cost update log file.
- Regular: Every subroutine.
- Extended: Every SQL statement.
- Full: Same as Extended and keeps any temporary data in the database.
MRP:Debug Mode
Indicates whether to enable debug messages within Oracle Master Scheduling/MRP. Available values are listed below:
Enable debug messages.
Do not enable debug messages.
This profile has a predefined value of No upon installation.
MRP:Trace Mode
Indicates whether to enable the trace option within Oracle Master Scheduling/MRP and Supply Chain Planning. Available values are listed below:
Enable the trace option within Oracle Master
Scheduling/MRP and Supply Chain Planning.
Do not enable the trace option within Oracle
Master Scheduling/MRP and Supply Chain Planning.
This profile has a predefined value of No upon installation.
8. How to generate an GL debug log file
Detail Log for GL programs
Used for concurrent request problems where we need to know what sql was used in key areas or we need to retain temporary tables.
Note: Be aware that temp tables are never dropped so leaving this on will create a build up of many temporary tables throughout GL, like gl_posting_interim_nnnnn
-
Set GL: Debug Mode profile option to Yes, run the program and provide the program log.
Note: This profile option introduced in GL 11i FP.D initially allowed 5 main GL concurrent processes (Posting, Translation, Consolidation, Revaluation and Mass Allocation) to be run in debug mode without the requirement for operating system command line access. This enhancement has not been released as a stand-alone patch. -
Switch the profile back to No when the test is complete.
Note:On solving your current problems please get your DBA to delete temporary tables see Internal
Note.176180.1 Can the GL_Posting_Interim_XXX and GL_Summary_Interim_X_XXX Tables be Deleted?:
FND Log Messages
OA Framework (OA Fwk)
This is for web page issues like accounting setup manager, account analysis drill down, fsg drill down etc.
-
Log into system admin responsibility and set the following profile options at user level :
FND: Debug Log Enabled - Yes
FND: Debug Log Level - Statement -
Run the following select in sqlplus :
SELECT MAX(log_sequence) FROM fnd_log_messages;
Take the max of log sequence and use it as log_seq1 in step#5
-
Reproduce the issue with above user for which fnd profile options are set.
-
Run the following select in sqlplus :
SELECT MAX(log_sequence) FROM fnd_log_messages;
Take the max of log sequence and use it as log_seq2 in step#5
- Run following select to get the log messages and provide in xls format ::
SELECT LOG_SEQUENCE, MESSAGE_TEXT, USER_ID
FROM fnd_log_messages
WHERE log_sequence > log_seq1-1 and log_sequence < log_seq2+1 ;
You can also use
SELECT log_sequence, message_text,substr(module,1,100)
FROM fnd_log_messages msg
where log_sequence between <min_log_seq> and <max_log_seq>
ORDER BY LOG_SEQUENCE ;
- Switch the FND: Debug Log Enabled profile back to No when the test is complete.
Reference:
Methods To Obtain Log And Trace Information For Development on Financial Control Issues [ID 1168784.1]
9. How to generate an AR debug log file
-
Check value of profile option :AR: Enable Debug Message Output, it should be set to Yes
-
Run the following select statement to determine where the log will write to :
select value from v$parameter where upper(name) = 'UTL_FILE_DIR'
this returns something like :
VALUE
/usr/tmp, /usr/tmp, /u01/oracle/mc3yd213/db/tech_st/11.1.0/appsutil/outbound/mc3yd213_bej301441, /usr/tmp
The above is just an example, the values for your database may be different,take note of the values as you will need to supply it later.
- In the application, once you are in the form that you want to debug,click on :
Help - Examine
fill in window that pops up :
block = PARAMETER
field = AR_DEBUG_FLAG
value = FS <utl_file_dir> <debug_file.log>
wherein you replace utl_file_dir with a value from the select above, and debug_file.log with an actual debug file name,
e.g. : FS /usr/tmp debug1.log
NOTE :
- the spacing above is important, there is a space after FS and space before debug1.log
- there is no LOV for field, you need to explicitly type in AR_DEBUG_FLAG
- you need to type in the path exactly as shown in the select statement in #2
navigate through the form as normal, once done, exit the form
in Unix : go to the utl_file_dir path you specified and you should find a file with the name you specified in #3
For More Information:
How Do You Create Debug Logs For AR Code [ID 205465.1]
10. How to generate an AP debug log file
- FND: Debug Log Enabled Yes
- FND: Debug Log Filename
- FND: Debug Log Level STATEMENT
- FND: Debug Log Mode Asynchronous with Cross-Tier Sequencing
- FND: Debug Log Module % or AP%
No need to stop and restart E-Business Suite.
All log information will be created in the table FND_LOG_MESSAGES. A typical query might be
SQL> select module||' '||message_text from fnd_log_messages order by time stamp;
11. EBS FRD(Forms Runtime Diagnostics) Log的收集方法
什么是EBS FRD?
Forms Runtime Diagnostics,用于记录Form级别日志,例如,Form Build_In的调用,Form Error(FRM-xxx),Message,Exception
怎样收集FRD日志
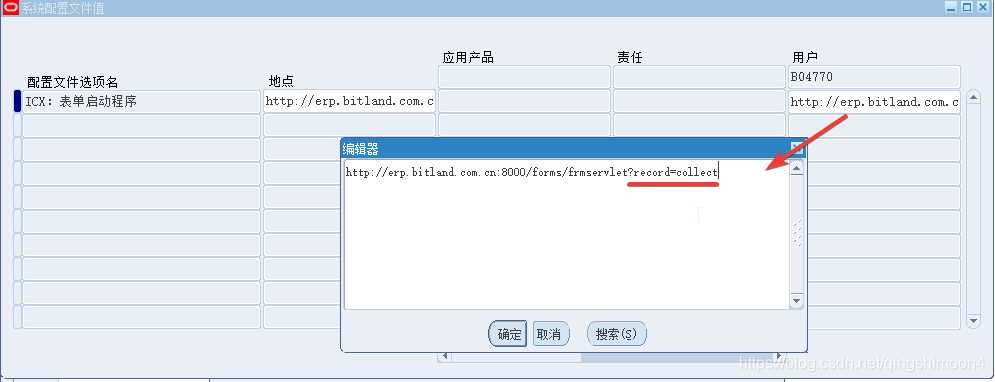
1.以系统管理员登陆
Append the user value of ICX: Forms Launcher with the Forms parameters for FRD i.e ‘?record=collect’
In Servlet mode
http://hostname.domain:port/forms/frmservlet?record=collect
In Socket mode
http://hostname.domain:port/OA_HTML/frmservlet?record=collect
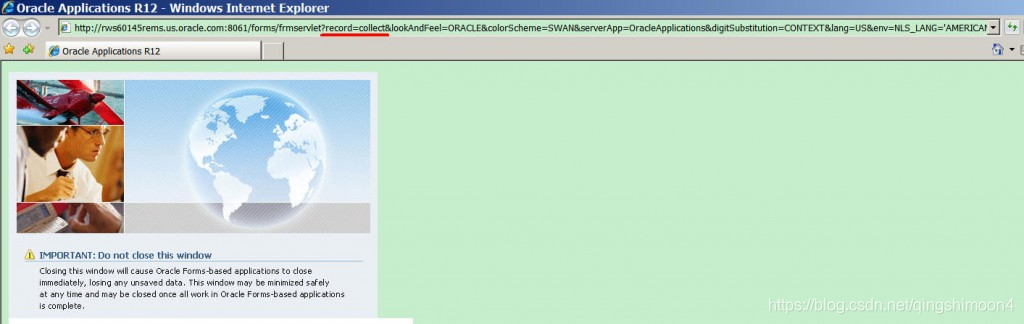
2.Logout and Re-Login
登陆页面的link能够看到"?record=collect"
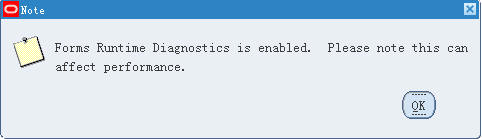
登陆后应该能看到下边的提示,说明FRD已经enabled
3.Reproduce the issue
4.查找FRD在服务器的路径
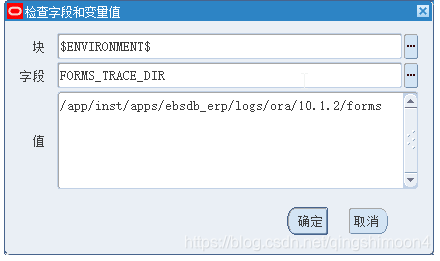
$ENVIRONMENT$.FORMS_TRACE_DIR(11i为forms60_trace_path)
eg./u01/R122_EBS/inst/apps/mz3st220_rws3220388/logs/ora/10.1.2/forms
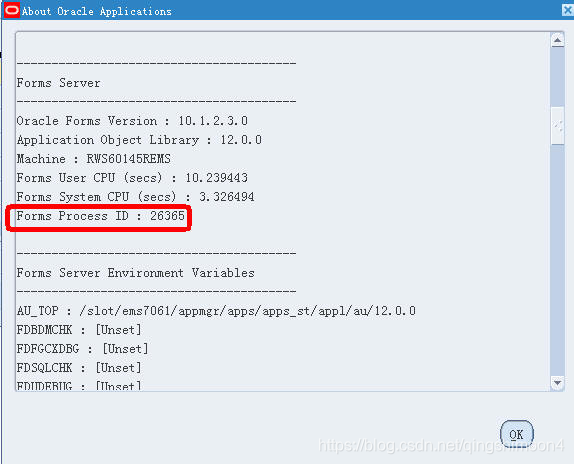
5.collect_ where is the process identifier
eg.Forms Process ID : 17089
Reference Note: 438652.1
=EOF=
12. Oracle EBS SQL Trace日志收集的方法
Raw Trace的收集方法
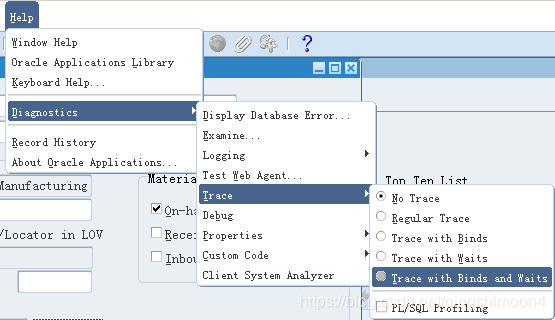
- 打开Trace,Help > Diagnostics > Trace > Trace > Trace with Binds and Waits
Trace项代表的意思
- No Trace – turns trace off.
- Regular Trace – generates a regular SQL trace by performing the following statement:
ALTER SESSION SET SQL_TRACE = TRUE; - Trace with Binds – writes bind variable values in the SQL trace file
- Trace with Waits – writes wait events in the SQL trace file
- Trace with Binds and Waits – writes both bind variable values and wait events in the SQL trace file
2.执行业务功能
- 关闭Trace,Help > Diagnostics > Trace > Trace > No Trace
系统会弹出一个窗口,告诉你Trace文件所在的目录。
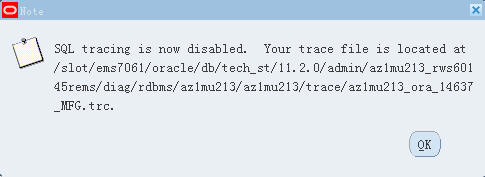
这个目录实际上是数据库系统参数表(v$parameter)中的user_dump_dest的值,可以执行下边的SQL来找到Trace文件所在的目录
SELECT value FROM v$parameter WHERE name = 'user_dump_dest';
Output:/slot/ems7061/oracle/db/tech_st/11.2.0/admin/az1mu213_rws60145rems/diag/rdbms/az1mu213/az1mu213/trace
trace文件名后边的那个数字是Database Server PID,也可以从Help>About中找到。