import F2 from '@antv/f2';
const data = [{
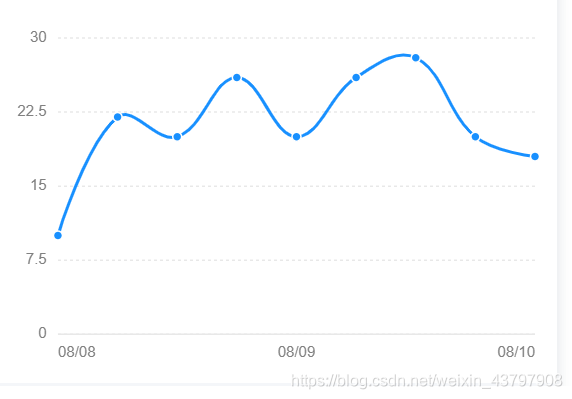
time: '2016-08-08 00:00:00',
tem: 10
}, {
time: '2016-08-08 00:10:00',
tem: 22
}, {
time: '2016-08-08 00:30:00',
tem: 16
}, {
time: '2016-08-09 00:35:00',
tem: 26
}, {
time: '2016-08-09 01:00:00',
tem: 12
}, {
time: '2016-08-09 01:20:00',
tem: 26
}, {
time: '2016-08-10 01:40:00',
tem: 18
}, {
time: '2016-08-10 02:00:00',
tem: 26
}, {
time: '2016-08-10 02:20:00',
tem: 12
}];
const chart = new F2.Chart({
id: 'container',
pixelRatio: window.devicePixelRatio
});
chart.source(data, {
time: {
type: 'timeCat',
tickCount: 3,//横坐标显示几个
range: [ 0, 1 ]
},
tem: {
tickCount: 5,
min: 0,//纵坐标的最小值,一般不需要设置max,设置max容易导致纵坐标错乱
alias: '总收益',//点击折线图后显示的tip值,如果不设置会直接显示tem:12,设置后显示总收益:12
}
});
chart.axis('time', {
label: function label(text, index, total) {
const textCfg = {};
if (index === 0) {
textCfg.textAlign = 'left';
} else if (index === total - 1) {
textCfg.textAlign = 'right';
}
textCfg.fontSize='16'//设置time坐标轴的坐标轴字体大小
return textCfg;
}
});
chart.axis('tem', {
label: function label(text, index, total) {
const textCfg = {};
textCfg.fontSize='18'//设置tem坐标轴的坐标轴字体大小
return textCfg;
}
});
chart.tooltip({
showCrosshairs: true
});
chart.area()
.position('time*tem')
.color('l(90) 0:#1890FF 1:#f7f7f7')
.shape('smooth');
chart.line()
.position('time*tem')
.color('l(90) 0:#1890FF 1:#f7f7f7')
.shape('smooth');
chart.render();
其中遇到的坑
纵坐标排序混乱—>解决方法:data里的纵坐标需要是数字形式,不能是字符串的格式,可以通过parseFloat()或者parseInt()进行转化
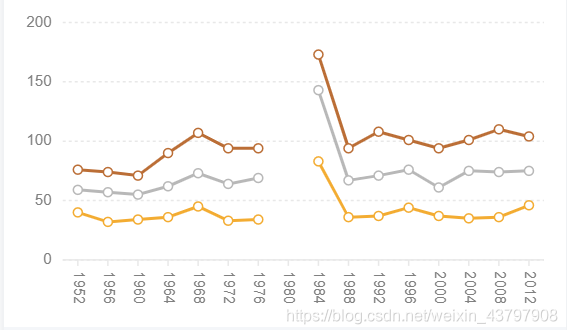
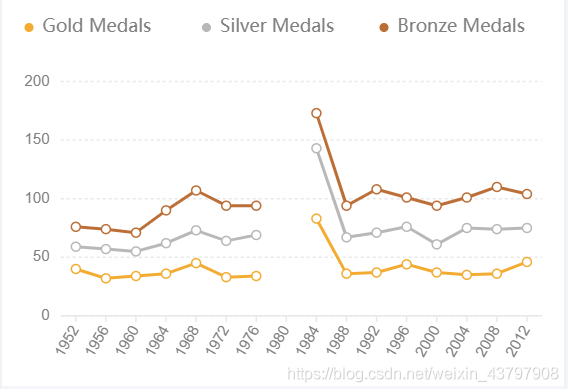
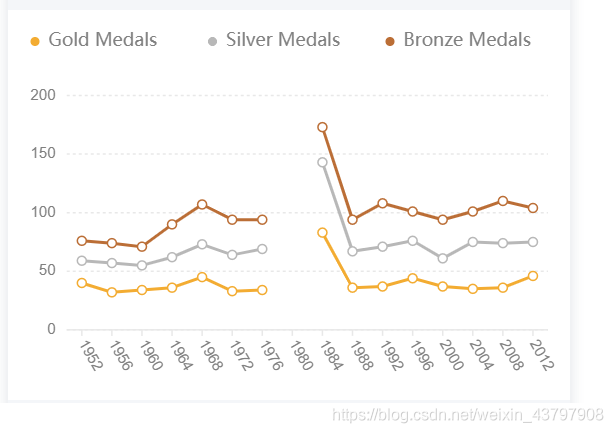
在项目中可能会用到很多以下这种图:横坐标斜体显示多条数据
import F2 from '@antv/f2';

const data = [{
  time: '2016-08-08 00:00:00',
  tem: 10
}, {
  time: '2016-08-08 00:10:00',
  tem: 22
}, {
  time: '2016-08-08 00:30:00',
  tem: 16
}, {
  time: '2016-08-09 00:35:00',
  tem: 26
}, {
  time: '2016-08-09 01:00:00',
  tem: 12
}, {
  time: '2016-08-09 01:20:00',
  tem: 26
}, {
  time: '2016-08-10 01:40:00',
  tem: 18
}, {
  time: '2016-08-10 02:00:00',
  tem: 26
}, {
  time: '2016-08-10 02:20:00',
  tem: 12
}];
const chart = new F2.Chart({
  id: 'container',
  pixelRatio: window.devicePixelRatio
});
chart.source(data, {
  tem: {
    tickCount: 5,
    min: 0,//纵坐标的最小值,一般不需要设置max,设置max容易导致纵坐标错乱
    alias: '总收益',//点击折线图后显示的tip值,如果不设置会直接显示tem:12,设置后显示总收益:12
  }
});

chart.axis('time', {
  tickLine: {
     length: 4,
     stroke: '#e8e8e8',
     lineWidth: 1
   },
   label: {
     textAlign: 'end',//改变横坐标的显示位置,可以设置start或者end
     textBaseline: 'middle',
     fontSize:'13',//横坐标字号
     rotate: -Math.PI / 3 //倾斜角度

     //Math.PI / 2 纵坐标垂直显示
     //Math.PI / 3 和-Math.PI / 3都是倾斜显示,只是方向相反
     //如果是Math.PI / 3 正向的就设置textAlign: 'start'
     //如果是-Math.PI / 3 反向的就设置textAlign: 'end'
   }
});
chart.axis('tem', {
  label: function label(text, index, total) {
    const textCfg = {};
    textCfg.fontSize='18'//设置tem坐标轴的坐标轴字体大小
    return textCfg;
  }
});
chart.tooltip({
  showCrosshairs: true
});

chart.area()
  .position('time*tem')
  .color('l(90) 0:#1890FF 1:#f7f7f7')
  .shape('smooth');
chart.line()
  .position('time*tem')
  .color('l(90) 0:#1890FF 1:#f7f7f7')
  .shape('smooth');
chart.render();