squarified treemap实现
文章目录
实验内容:
- squarified treemap实现
1 A brief introduction to treemap
1.1 example
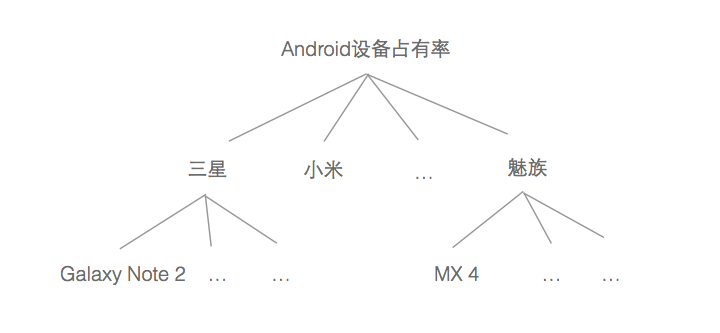
treemap 适合展现具有层级关系的数据,能够直观的体现同级之间的比较。例如下列原始的Android设备手机占有率用原始的分叉树实现效果不是很好,看不出比例关系。
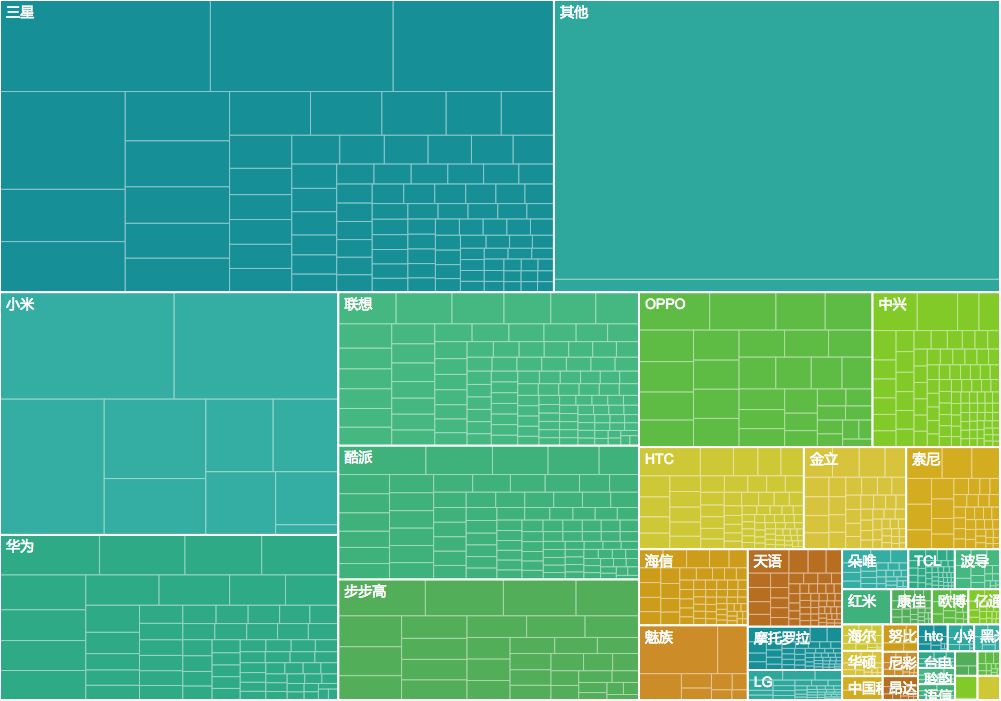
使用下面的treemap来展示效果好得多,可以清楚的看到每个品牌占有的份额,也能看见同一品牌下各个型号的份额,份额信息通过矩形面积表示。
1.2 history
Treemap由马里兰大学教授Ben Shneiderman于上个世纪90年代提出,起初是为了找到一种有效了解磁盘空间使用情况的方法:
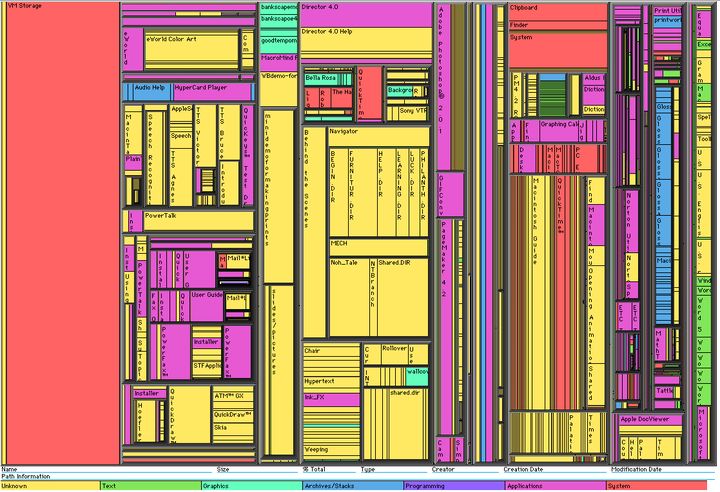
Treemap最早用的是Slice and Dice算法,在上图中出现了非常狭长的矩形带,对人眼观察不太友好。后来提出了矩形正方化(squarified)的思想使得可视化出来的矩形长宽比尽量接近1,以正方形展示。大致如下:
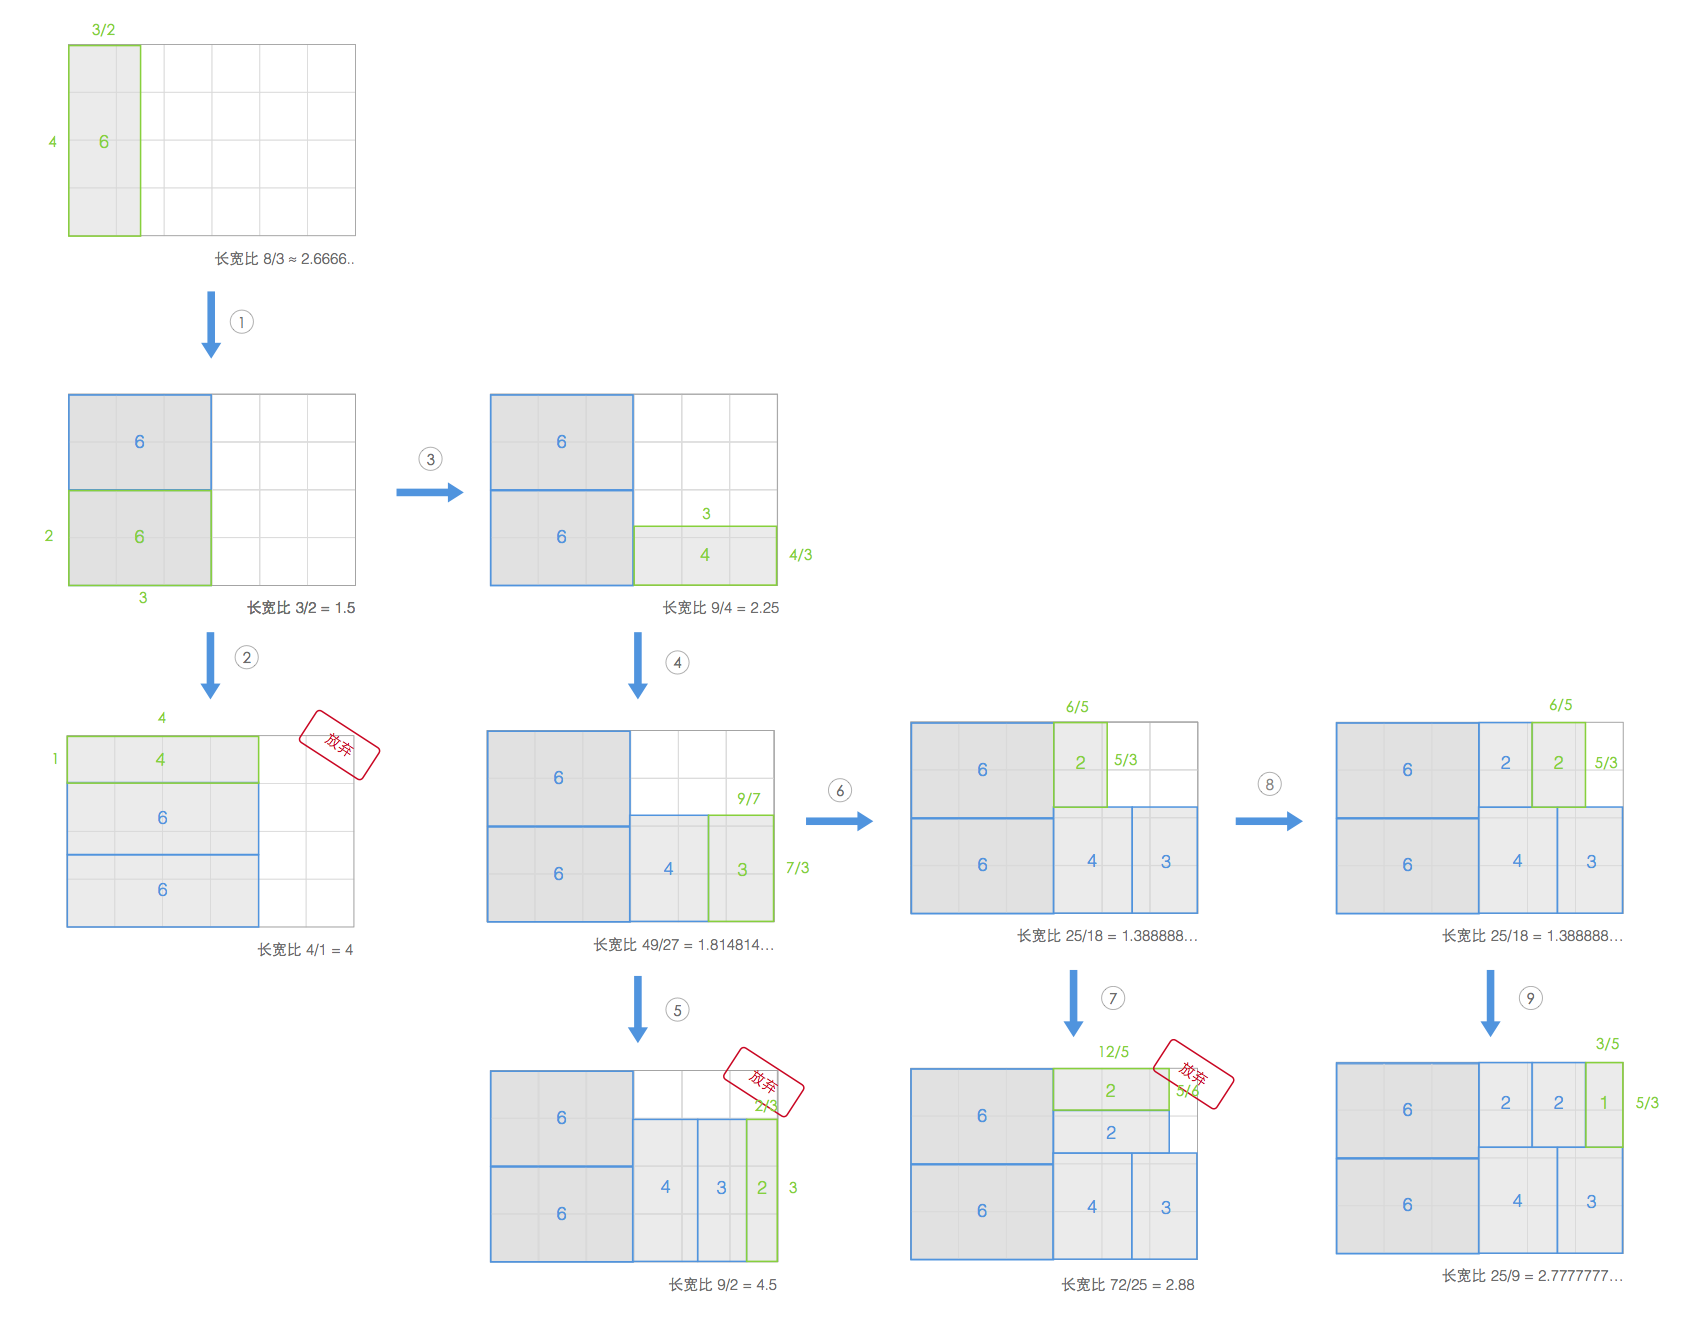
采用此种布局方法有效减少了狭长矩形的数量。
所以squarified rectangles有以下好处:
- 可以更加充分的利用空间。因为采用正方形布局,矩形周长和可达到最小(因为代表所有文件大小的最终面积是固定的),边界长度即矩形周长,squarify可以较少边界长度
- 狭长的矩形容易产生混叠错误,正方形容易观察
- 矩形长宽比趋近1时人眼可以方便比较它们的面积
- squarify可以提升可视化精度
2 python实现
2.1 代码说明
利用python的matplotlib编程实现squarified treemap算法。
程序指定窗口大小,将给定数据根据窗口大小进行缩放并按面积降序排序。各部分函数功能如下:
- normal_sort_size(size_list) 返回经过规范化且按面积降序排序的原始数据list
- worst_ratio(size_list,w): 计算并返回当前绘图区域内矩形的最大纵横比,其中w是当前绘图矩形区域较小的一边的长度
- layout(render_list, layout_side, start_point):以start_point为基点,绘制render_list内的所有矩形
- squarify(current_fixed_rec_list, rec_to_layout, layout_side, start_point, screen_width, screen_height):current_fixed_rec_list保存当前绘制区域已选定绘制的矩形,rec_to_layout保存等待绘制的矩形,layout_side为元组tuple,保存当前区域矩形绘制的叠加方向以及区域在该方向上的长度,start_point, screen_width, screen_height分别保存当前绘制区域的左下角对应的坐标,区域的宽和长。该函数是算法的核心函数,判断下一个矩形是绘制在当前子区域,还是绘制在另一个子区域。
- render(list_to_layout):接受原始的待可视化的数据,函数内调用squarify()函数
import matplotlib.pyplot as plt
import numpy as np
#规定展示区域的窗口大小
Width = 6
Height = 4
data = [6,4,6,3,2,2,1]
ratio = np.sum(data)/(Width*Height)

color_alpha  = 1
#将原始的大小数组通过窗口正则化
def normal_sort_size(size_list):
    new_size_list=[]
    target_area = Width*Height
    original_area = np.sum(size_list)
    for size in size_list:
        new_size_list.append(size*(target_area/original_area))
    #降序排序
    new_size_list = sorted(new_size_list,reverse=True)
    return new_size_list

#w is the length of the side along which the latest rectangle is layouted
#size_list 当前渲染区域的矩形
def worst_ratio(size_list,w):
    sum_area = np.sum(size_list)
    buttom_length = sum_area / float(w)
    #计算最大长宽比
    min_area = min(size_list)
    ratio1 = max(min_area/pow(buttom_length,2), pow(buttom_length,2)/min_area)
    max_area=max(size_list)
    ratio2 = max(max_area/pow(buttom_length,2), pow(buttom_length,2)/max_area)
    return max(ratio1,ratio2)

#定义绘图区域
fig1 = plt.figure()
ax1 = fig1.add_subplot(111, aspect='equal')

#绘制图形
#layout_direction 为矩形叠加方向 即
def layout(render_list, layout_side, start_point):
    global color_alpha
    sum_area = np.sum(render_list)
    buttom_length = sum_area / layout_side[0]
    if layout_side[1] == 'y':#沿着y轴增长
        for rec in render_list:
            print('y: ',start_point,buttom_length, rec/buttom_length)
            ax1.add_patch( plt.Rectangle(start_point, buttom_length, rec/buttom_length, color='steelblue', alpha=color_alpha) )
            color_alpha = color_alpha/1.2
            #添加文字注释
            plt.text(start_point[0]+buttom_length/2, start_point[1]+rec/(2*buttom_length), str(rec*ratio))
            start_point = (start_point[0], start_point[1]+rec/buttom_length)
    else:#沿着x轴增长
        for rec in render_list:
            print('x: ',start_point,buttom_length, rec/buttom_length)
            ax1.add_patch( plt.Rectangle(start_point, rec/buttom_length, buttom_length, color='steelblue', alpha=color_alpha) )
            color_alpha = color_alpha/1.2
            #添加文字注释
            plt.text(start_point[0]+rec/(2*buttom_length), start_point[1]+buttom_length/2, str(rec*ratio))
            start_point = (start_point[0]+rec/buttom_length, start_point[1])

#布局所有矩形
#start_point:当前绘制区域的左下角坐标
#layout_side是一个元组,(width_of_layout_side,direction_of_layout_side)
def squarify(current_fixed_rec_list, rec_to_layout, layout_side, start_point, screen_width, screen_height):
    #取出下一个待放置矩形并从未防止矩形列表中删除
    if rec_to_layout==[]:
        layout(current_fixed_rec_list, layout_side, start_point)
        return
    next_rec = rec_to_layout[0]
    tmp = current_fixed_rec_list.copy()
    tmp.append(next_rec)

    if current_fixed_rec_list==[]:
        rec_to_layout.pop(0)
        squarify(tmp, rec_to_layout, layout_side, start_point, screen_width, screen_height)
    else:
        #判断当前区域渲染
        buttom_length = np.sum(current_fixed_rec_list) / layout_side[0]
        #当前区域不能再放置矩形,寻找下一个区域
        if worst_ratio(current_fixed_rec_list, layout_side[0]) < worst_ratio(tmp, layout_side[0]):
            layout(current_fixed_rec_list, layout_side, start_point)
            if layout_side[1]=='y':#原先沿着y轴生长
                screen_width -= buttom_length#新窗口的width
                new_start_point = (start_point[0]+buttom_length, start_point[1])
            else:#layout[1]=='x'原来是沿着x轴生长
                screen_height -= buttom_length#新窗口的height
                new_start_point = (start_point[0], start_point[1]+buttom_length)
            #判断当前区域走向
            if screen_width < screen_height:
                #沿着x轴生长
                squarify([], rec_to_layout, [screen_width,'x'], new_start_point,screen_width,screen_height)
            else:#smaller_side(screen_width, screen_height) == screen_height
                squarify([], rec_to_layout, [screen_height,'y'], new_start_point,screen_width,screen_height)
        #当前区域继续放置矩形
        else:
            rec_to_layout.pop(0)
            squarify(tmp, rec_to_layout, layout_side, start_point, screen_width, screen_height)

#调用API
def render(list_to_layout):
    to_layout_list = normal_sort_size(list_to_layout)
    if Width > Height:
        squarify([], to_layout_list, [Height,'y'], (0,0), Width, Height)
    else:
        squarify([], to_layout_list, [Width,'x'], (0,0), Width, Height)

if __name__ == "__main__":
    render(data)
    plt.xlim(0, Width)
    plt.ylim(0, Height)
    plt.show()
    plt.axis('off')
    fig1.savefig('rect1.png', dpi=90, bbox_inches='tight')
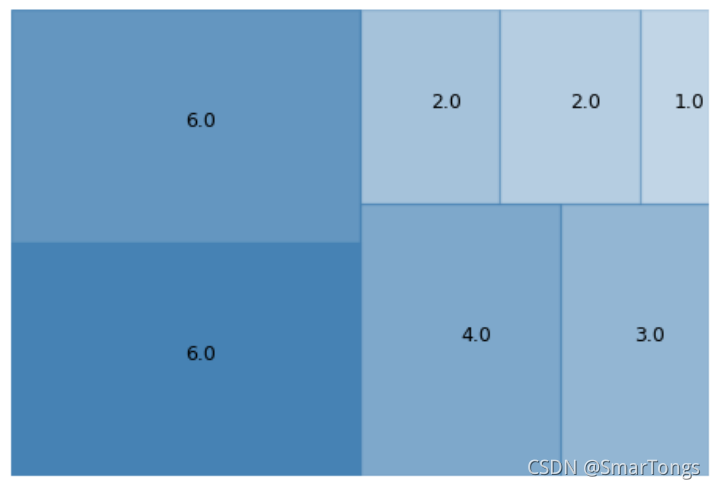
2.2 效果展示
论文中的example,颜色越深代表的数值越大:
将数据改为data=[1,2,3,4,5,6,7,8,9],可视化效果为:
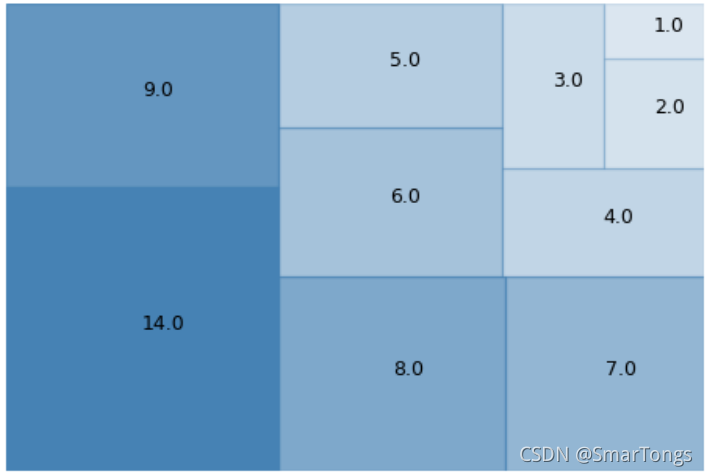
可以看见数据适应了自定义窗口的大小,矩形显示的标签是其真实的面积大小。鉴于展示坐标轴可能给人误导,我们在程序中隐藏坐标轴
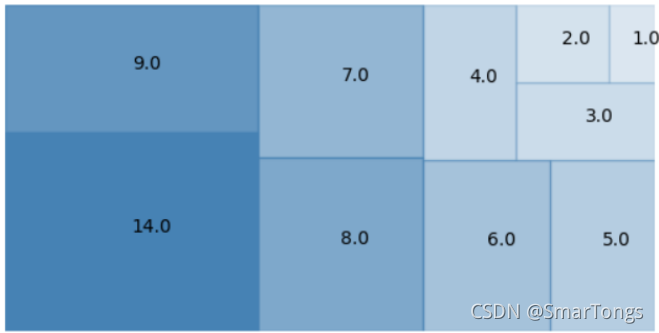
我们也可以更改窗口大小
3 基于Observable的d3实现
使用d3可以调用内置的treemap API。
笔记链接:https://observablehq.com/@smartog/treemap
3.1 代码说明
Observable中创建treemap主体程序
chart = {


  //创建根节点
  const root = treemap(data);
  //新建画布
  const svg = d3.create("svg")
      .attr("viewBox", [0, 0, width, height])//视图大小
      .style("font", "10px sans-serif");//字号以及字体
  //添加叶子
  const leaf = svg.selectAll("g")
    .data(root.leaves())
    .join("g")
    .attr("transform", d => `translate(${

      d.x0},${

      d.y0})`);

  leaf.append("title")
      .text(d => `${

      d.ancestors().reverse().map(d => d.data.name).join("/")}\n${

      format(d.value)}`);

  //添加矩形
  leaf.append("rect")
      .attr("id", d => (d.leafUid = DOM.uid("leaf")).id)
      .attr("fill", d => {

     while (d.depth > 1) d = d.parent; return color(d.data.name); })
      .attr("fill-opacity", 0.6)
      .attr("width", d => d.x1 - d.x0)
      .attr("height", d => d.y1 - d.y0);
  //隐藏
  leaf.append("clipPath")
      .attr("id", d => (d.clipUid = DOM.uid("clip")).id)
    .append("use")
      .attr("xlink:href", d => d.leafUid.href);
  //添加数值标签
  leaf.append("text")
      .attr("clip-path", d => d.clipUid)
    .selectAll("tspan")
    .data(d => d.data.name.split(/(?=[A-Z][a-z])|\s+/g).concat(format(d.value)))
    .join("tspan")
    .attr("x", 3)
    .attr("y", (d, i, nodes) => `${

      (i === nodes.length - 1) * 0.3 + 1.1 + i * 0.9}em`)
    .attr("fill-opacity", (d, i, nodes) => i === nodes.length - 1 ? 0.7 : null)
    .text(d => d);

  return svg.node();
}
导入数据
data = FileAttachment("my_test.json").json()
定义treemap
treemap = data => d3.treemap()
    .tile(tile)//选择的建树方式,通过上述下滑框选定
    .size([width, height])
    .padding(1.5)//间隙
    .round(true)
  (d3.hierarchy(data)
      .sum(d => d.value)
      .sort((a, b) => b.value - a.value))//按照类的总量降序排序,升序改为a.value - b.value
由于d3支持多种可视化方法,我们可以指定传参,在Observable中可见下拉框
viewof tile = {


  //创建五种不同方法选项
  const options = [
    {

    name: "d3.treemapBinary", value: d3.treemapBinary},
    {

    name: "d3.treemapDice", value: d3.treemapDice},
    {

    name: "d3.treemapSlice", value: d3.treemapSlice},
    {

    name: "d3.treemapSliceDice", value: d3.treemapSliceDice},
    {

    name: "d3.treemapSquarify", value: d3.treemapSquarify, selected: true}//默认选择squarify方法
  ];
  //下拉框选项
  const form = html`<form style="display: flex; align-items: center; min-height: 33px;"><select name=i>${

      options.map(o => Object.assign(html`<option>`, {

      textContent: o.name, selected: o.selected}))}`;

  form.oninput = () => form.value = options[form.i.selectedIndex].value;

  return form;
}
3.2 效果展示
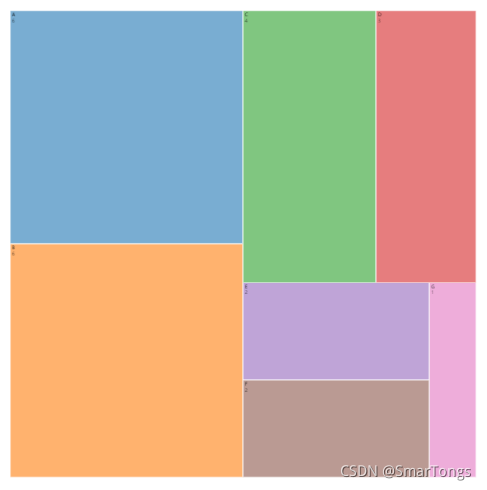
3.2.1 Squarified Treemap
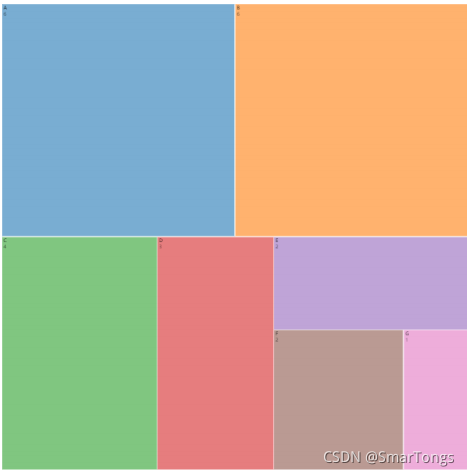
3.2.2 Binary Treemap
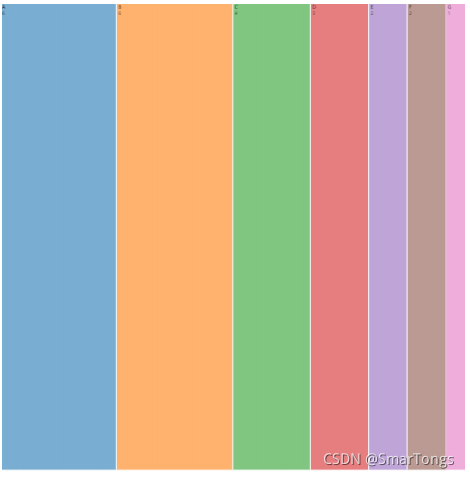
3.2.3 SliceDice Treemap
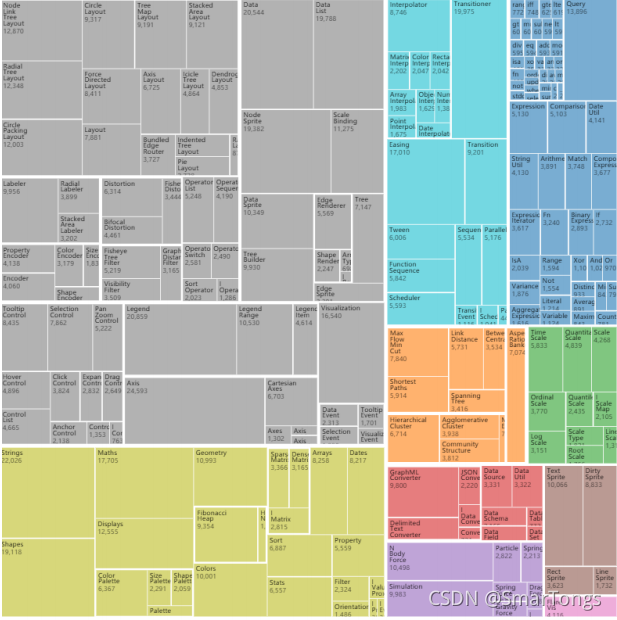
3.2.4 使用flare-2.json数据效果更明显