2021年美赛A题真菌特性数据曲线拟合及绘制Matlab代码实现
clearvars; clc; % fit_ER_DR.m
target_path_1 = 'D:\SJTU大三(上)总\杂项\科研项目\2021MCM\regulation_test\figures\curve_fitting\matlab_fig\ER-DR\10_celsius_ER-DR_fitted_curve.png';
target_path_2 = 'D:\SJTU大三(上)总\杂项\科研项目\2021MCM\regulation_test\figures\curve_fitting\matlab_fig\ER-DR\16_celsius_ER-DR_fitted_curve.png';
target_path_3 = 'D:\SJTU大三(上)总\杂项\科研项目\2021MCM\regulation_test\figures\curve_fitting\matlab_fig\ER-DR\22_celsius_ER-DR_fitted_curve.png';
filepath_e = 'D:\SJTU大三(上)总\杂项\科研项目\2021MCM\regulation_test\data\preprocessed data\csv format\extension rate.csv';
filepath_d = 'D:\SJTU大三(上)总\杂项\科研项目\2021MCM\regulation_test\data\preprocessed data\csv format\decompose rate.csv';
exten_rate_num = importdata(filepath_e);
decop_rate_num = importdata(filepath_d); % import extension rate and decompose rate
log_decop = log(decop_rate_num); % take the logarithm of the decompose rate
clear filepath_e filepath_d decop_rate_num;
linear_func = @(p, x) p(1) .* x(:,1) + p(2); % establish linear model
p0 = [0.424, 0.885]; % initial parameter
k = []; b = [];
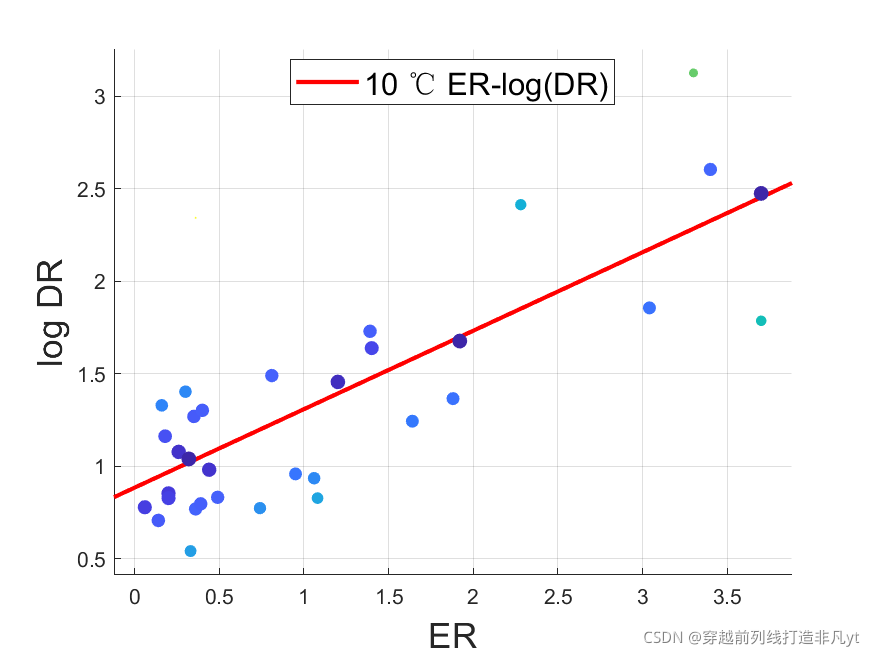
figure(1);
x_to_fit = exten_rate_num(:,1); y_to_fit = log_decop(:,1);
x_space = (max(x_to_fit) - min(x_to_fit) ) / 20;
y_space = (max(y_to_fit) - min(y_to_fit) ) / 20;
x_llim = min(x_to_fit) - x_space; x_rlim = max(x_to_fit) + x_space;
y_llim = min(y_to_fit) - y_space; y_rlim = max(y_to_fit) + y_space; % find limit range of x and y
set(gca, 'xlim', [x_llim, x_rlim]); hold on; set(gca, 'ylim', [y_llim, y_rlim]); hold on;
[p, R] = nlinfit(x_to_fit, y_to_fit, linear_func, p0); % nonlinear fitting
p0 = p; R = abs(R); R_max = max(R); c = R; R = R_max - R; sz = R * 39 +1;
k_fitted = p(1); b_fitted = p(2); k(1) = k_fitted; b(1) = b_fitted;
fitted_func = @(x,y) k_fitted * x + b_fitted - y; % establish implicit function
fimplicit(fitted_func, [x_llim x_rlim y_llim y_rlim], 'r', 'LineWidth', 2);
scatter(x_to_fit, y_to_fit, sz, c, 'filled'); hold on; grid on;
legend('10 ℃ ER-log(DR)','Location','Best', 'FontSize', 15); xlabel('ER', 'FontSize', 17); ylabel('log DR', 'FontSize', 17);
saveas(gcf, target_path_1); clear target_path_1; close all;
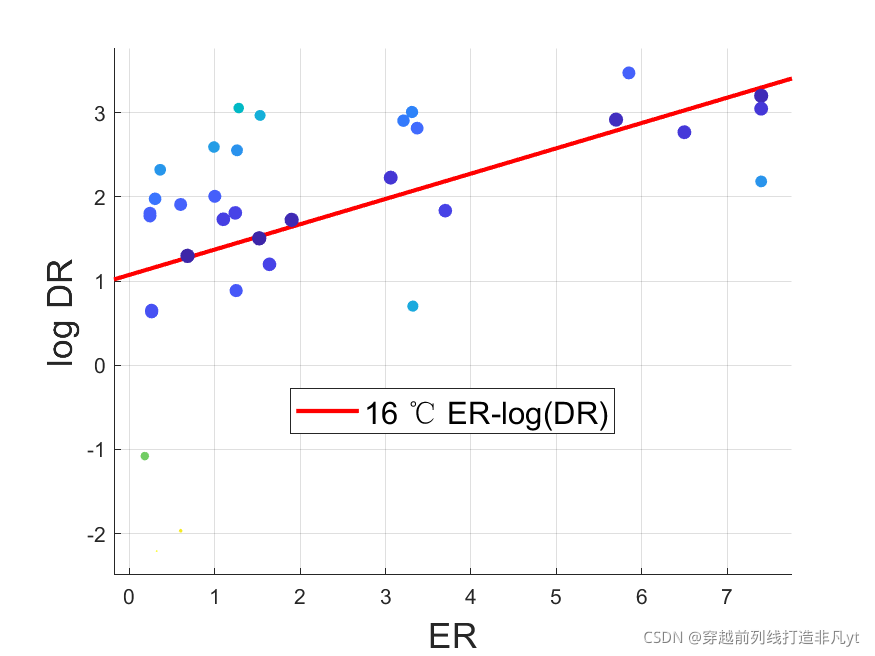
figure(2);
x_to_fit = exten_rate_num(:,2); y_to_fit = log_decop(:,2);
x_space = (max(x_to_fit) - min(x_to_fit) ) / 20;
y_space = (max(y_to_fit) - min(y_to_fit) ) / 20;
x_llim = min(x_to_fit) - x_space; x_rlim = max(x_to_fit) + x_space;
y_llim = min(y_to_fit) - y_space; y_rlim = max(y_to_fit) + y_space; % find limit range of x and y
set(gca, 'xlim', [x_llim, x_rlim]); hold on; set(gca, 'ylim', [y_llim, y_rlim]); hold on;
[p, R] = nlinfit(x_to_fit, y_to_fit, linear_func, p0); % nonlinear fitting
p0 = p; R = abs(R); R_max = max(R); c = R; R = R_max - R; sz = R * 14 +1;
k_fitted = p(1); b_fitted = p(2); k(2) = k_fitted; b(2) = b_fitted;
fitted_func = @(x,y) k_fitted * x + b_fitted - y; % establish implicit function
fimplicit(fitted_func, [x_llim x_rlim y_llim y_rlim], 'r', 'LineWidth', 2);
scatter(x_to_fit, y_to_fit, sz, c, 'filled'); hold on; grid on;
legend('16 ℃ ER-log(DR)','Location','Best', 'FontSize', 15); xlabel('ER', 'FontSize', 17); ylabel('log DR', 'FontSize', 17);
saveas(gcf, target_path_2); clear target_path_2; close all;
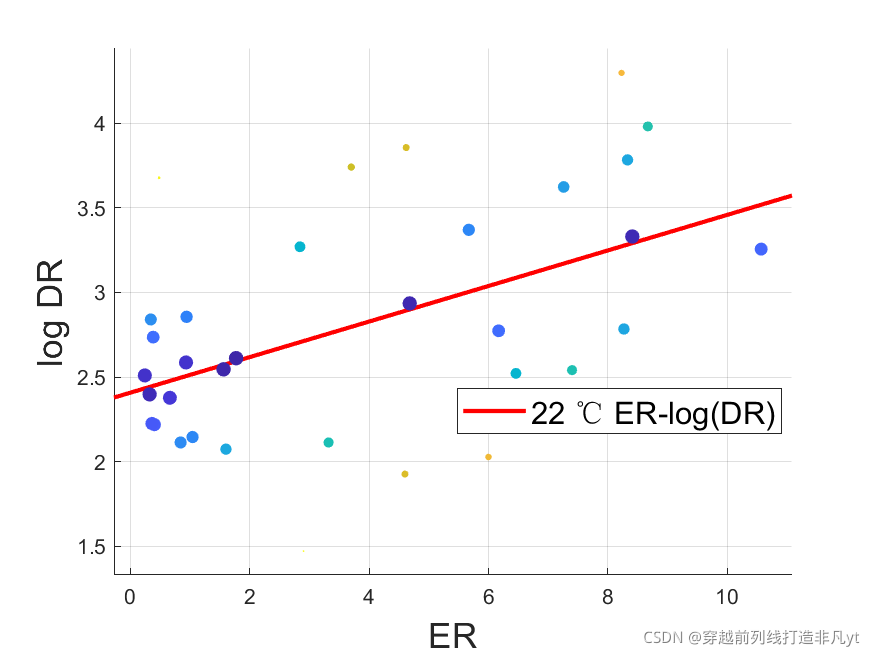
figure(3);
x_to_fit = exten_rate_num(:,3); y_to_fit = log_decop(:,3);
x_space = (max(x_to_fit) - min(x_to_fit) ) / 20;
y_space = (max(y_to_fit) - min(y_to_fit) ) / 20;
x_llim = min(x_to_fit) - x_space; x_rlim = max(x_to_fit) + x_space;
y_llim = min(y_to_fit) - y_space; y_rlim = max(y_to_fit) + y_space; % find limit range of x and y
set(gca, 'xlim', [x_llim, x_rlim]); hold on; set(gca, 'ylim', [y_llim, y_rlim]); hold on;
[p, R] = nlinfit(x_to_fit, y_to_fit, linear_func, p0); % nonlinear fitting
p0 = p; R = abs(R); R_max = max(R); c = R; R = R_max - R; sz = R * 39 +1;
k_fitted = p(1); b_fitted = p(2); k(3) = k_fitted; b(3) = b_fitted;
fitted_func = @(x,y) k_fitted * x + b_fitted - y; % establish implicit function
fimplicit(fitted_func, [x_llim x_rlim y_llim y_rlim], 'r', 'LineWidth', 2);
scatter(x_to_fit, y_to_fit, sz, c, 'filled'); hold on; grid on;
legend('22 ℃ ER-log(DR)','Location','Best', 'FontSize', 15); xlabel('ER', 'FontSize', 17); ylabel('log DR', 'FontSize', 17);
saveas(gcf, target_path_3); clear target_path_3; close all;
clear xlim ylim x_space y_space x_llim x_rlim y_llim y_rlim k_fitted b_fitted linear_func p p0 x_to_fit y_to_fit R R_max sz c fitted_func;
效果图
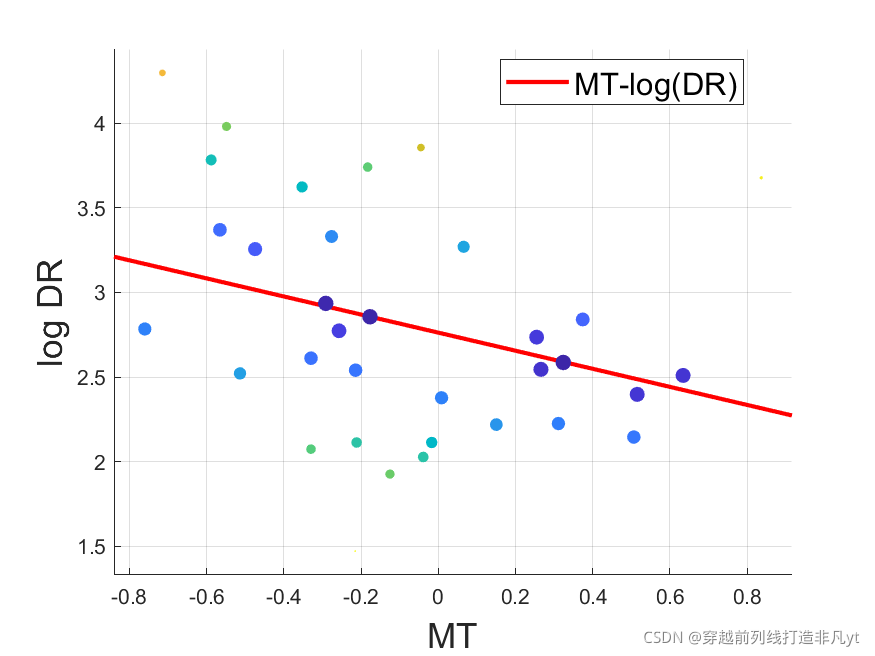

clearvars; clc; % fit_MT_DR
target_path = 'D:\SJTU大三(上)总\杂项\科研项目\2021MCM\regulation_test\figures\curve_fitting\matlab_fig\MT-DR\MT-DR_fitted_curve.png';
filepath = 'D:\SJTU大三(上)总\杂项\科研项目\2021MCM\regulation_test\data\preprocessed data\csv format\moisture_tolerance_decomposition_rate.csv';
mt_dr_mat = importdata(filepath); clear filepath;
linear_func = @(p, x) p(1) .* x(:,1) + p(2); % establish linear model
p0 = [-0.424, 0.885]; % initial parameter

figure(1);
x_to_fit = mt_dr_mat(:,1); y_to_fit = mt_dr_mat(:,2);
x_space = (max(x_to_fit) - min(x_to_fit) ) / 20;
y_space = (max(y_to_fit) - min(y_to_fit) ) / 20;
x_llim = min(x_to_fit) - x_space; x_rlim = max(x_to_fit) + x_space;
y_llim = min(y_to_fit) - y_space; y_rlim = max(y_to_fit) + y_space; % find limit range of x and y
set(gca, 'xlim', [x_llim, x_rlim]); hold on; set(gca, 'ylim', [y_llim, y_rlim]); hold on;
[p, R] = nlinfit(x_to_fit, y_to_fit, linear_func, p0); % nonlinear fitting
p0 = p; R = abs(R); R_max = max(R); c = R; R = R_max - R; sz = R * 39 +1;
k_fitted = p(1); b_fitted = p(2); k(1) = k_fitted; b(1) = b_fitted;
fitted_func = @(x,y) k_fitted * x + b_fitted - y; % establish implicit function
fimplicit(fitted_func, [x_llim x_rlim y_llim y_rlim], 'r', 'LineWidth', 2);
scatter(x_to_fit, y_to_fit, sz, c, 'filled'); hold on; grid on;
legend('MT-log(DR)','Location','Best', 'FontSize', 15); xlabel('MT', 'FontSize', 17);  ylabel('log DR', 'FontSize', 17);

saveas(gcf, target_path); clear target_path; close all;

clear xlim ylim x_space y_space x_llim x_rlim y_llim y_rlim k_fitted b_fitted linear_func p0 x_to_fit y_to_fit R R_max sz c fitted_func mt_dr_mat p;
clearvars; clc; % fit_MT_ER
ini_a = 0.45; ini_k = -1.18; ini_c = -0.22;% initial parameter
target_path = 'D:\SJTU大三(上)总\杂项\科研项目\2021MCM\regulation_test\figures\curve_fitting\matlab_fig\MT-ER\MT-ER_fitted_curve.png';
moi_ext_mat = importdata('D:\SJTU大三(上)总\杂项\科研项目\2021MCM\regulation_test\data\raw data\xlsx format\task2.xlsx');
moi_ext_mat = moi_ext_mat.data(:, [5, 6]); % select data
x_llim = min(moi_ext_mat(:,2)) - 0.1; x_rlim = max(moi_ext_mat(:,2)) + 0.1;
y_llim = min(moi_ext_mat(:,1)) - 0.1; y_rlim = max(moi_ext_mat(:,1)) + 0.1; % find limit range of x and y
figure(1); set(gca, 'xlim', [x_llim, x_rlim]); hold on; set(gca, 'ylim', [y_llim, y_rlim]); hold on;
xlabel('MT', 'FontSize', 17); ylabel('ER', 'FontSize', 17);
% scatter(moi_ext_mat(:,2), moi_ext_mat(:,1)); hold on; % scatter diagram
p0 = [ini_a, ini_k, ini_c]; clear ini_a ini_k ini_c;
exp_func = @(p, x) p(1) .* exp(p(2) .* x(:,1)) + p(3); % establish exponential model
x_to_fit = moi_ext_mat(:,2); y_to_fit = moi_ext_mat(:,1); clear moi_ext_mat; % prepared for fitting
[p, R] = nlinfit(x_to_fit, y_to_fit, exp_func, p0); % nonlinear fitting
R = abs(R); R_max = max(R); c = R; R = R_max - R; % scale residual error
clear R_max; sz = R * 99 +1;
a_fitted = p(1); k_fitted = p(2); c_fitted = p(3);% fitted parameter
fitted_func = @(x,y) a_fitted * exp(k_fitted * x) + c_fitted - y; % establish implicit function
fimplicit(fitted_func, [x_llim x_rlim y_llim y_rlim], 'r', 'LineWidth', 2);
scatter(x_to_fit, y_to_fit, sz, c, 'filled'); hold on;
clear p0 x_to_fit y_to_fit exp_func c sz R;
clear x_llim x_rlim y_llim y_rlim p fitted_func; grid on;
legend('MT-ER','Location','Best', 'FontSize', 15);
saveas(gcf, target_path); clear target_path; close all;