pod的status为CrashLoopBackOff,也可能是防火墙问题
[root@master systemd]# kubectl get pods --all-namespaces
NAMESPACE     NAME                                       READY   STATUS             RESTARTS        AGE
kube-system   calico-kube-controllers-58497c65d5-xhfsf   1/1     Running            7 (3h11m ago)   7d
kube-system   calico-node-cwqv4                          0/1     Running            3 (3h11m ago)   7d
kube-system   calico-node-fngr6                          0/1     Running            1 (116m ago)    131m
kube-system   calico-node-tv2zq                          0/1     CrashLoopBackOff   4 (63s ago)     4m5s
kube-system   coredns-7d89d9b6b8-9vswz                   1/1     Running            3 (3h11m ago)   7d7h
关闭防火墙后正常
[root@node2 ~]# systemctl status firewalld
● firewalld.service - firewalld - dynamic firewall daemon
   Loaded: loaded (/usr/lib/systemd/system/firewalld.service; disabled; vendor preset: enabled)
   Active: inactive (dead)
     Docs: man:firewalld(1)
[root@master systemd]# kubectl get pods --all-namespaces
NAMESPACE     NAME                                       READY   STATUS    RESTARTS         AGE
kube-system   calico-kube-controllers-58497c65d5-xhfsf   1/1     Running   7 (3h32m ago)    7d1h
kube-system   calico-node-cwqv4                          1/1     Running   3 (3h32m ago)    7d1h
kube-system   calico-node-fngr6                          1/1     Running   2 (6m5s ago)     152m
kube-system   calico-node-tv2zq                          1/1     Running   14 (6m22s ago)   25m
kube-system   coredns-7d89d9b6b8-9vswz                   1/1     Running   3 (3h32m ago)    7d7h
What is a Kubernetes CrashLoopBackOff? The meaning.
A CrashloopBackOff means that you have a pod starting, crashing, starting again, and then crashing again.
A PodSpec has a restartPolicy field with possible values Always, OnFailure, and Never which applies to all containers in a pod. The default value is Always and the restartPolicy only refers to restarts of the containers by the kubelet on the same node (so the restart count will reset if the pod is rescheduled in a different node). Failed containers that are restarted by the kubelet are restarted with an exponential back-off delay (10s, 20s, 40s …) capped at five minutes, and is reset after ten minutes of successful execution. This is an example of a PodSpec with the restartPolicy field:
apiVersion: v1
kind: Pod
metadata:
  name: dummy-pod
spec:
  containers:
    - name: dummy-pod
      image: ubuntu
  restartPolicy: Always
Why does a CrashLoopBackOff occur?
A quick Google search will show us that crash loop events can happen for a number of different reasons (and they happen frequently). Here are some of the umbrella causes for why they occur:
- The application inside the container keeps crashing
- Some type of parameters of the pod or container have been configured incorrectly
- An error has been made when deploying Kubernetes
How can I see if there are CrashLoopBackOff in my cluster?
Run your standard kubectl get pods command and you’ll be able to see the status of any pod that is currently in CrashLoopBackOff:
kubectl get pods --namespace nginx-crashloop
NAME                     READY     STATUS             RESTARTS   AGE
flask-7996469c47-d7zl2   1/1       Running            1          77d
flask-7996469c47-tdr2n   1/1       Running            0          77d
nginx-5796d5bc7c-2jdr5   0/1       CrashLoopBackOff   2          1m
nginx-5796d5bc7c-xsl6p   0/1       CrashLoopBackOff   2          1m
Actually if you see pods in Error status, probably they will get into CrashLoopBackOff soon:
kubectl get pods --namespace nginx-crashloop
NAME                     READY     STATUS    RESTARTS   AGE
flask-7996469c47-d7zl2   1/1       Running   1          77d
flask-7996469c47-tdr2n   1/1       Running   0          77d
nginx-5796d5bc7c-2jdr5   0/1       Error     0          24s
nginx-5796d5bc7c-xsl6p   0/1       Error     0          24s
Doing a kubectl describe pod will give us more information on that pod:
kubectl describe pod nginx-5796d5bc7c-xsl6p --namespace nginx-crashloop
Name:           nginx-5796d5bc7c-xsl6p
Namespace:      nginx-crashloop
Node:           ip-10-0-9-132.us-east-2.compute.internal/10.0.9.132
Start Time:     Tue, 27 Mar 2018 19:11:05 +0200
Labels:         app=nginx-crashloop
                name=nginx
                pod-template-hash=1352816737
                role=app
Annotations:    kubernetes.io/created-by={"kind":"SerializedReference","apiVersion":"v1","reference":{"kind":"ReplicaSet","namespace":"nginx-crashloop","name":"nginx-5796d5bc7c","uid":"fb9e9518-f542-11e7-a8f2-065cff0...
Status:         Running
IP:             10.47.0.15
Controlled By:  ReplicaSet/nginx-5796d5bc7c
Containers:
  nginx:
    Container ID:   docker://513cab3de8be8754d054a4eff45e291d33b63e11b2143d0ff782dccc286ba05e
    Image:          nginx
    Image ID:       docker-pullable://nginx@sha256:c4ee0ecb376636258447e1d8effb56c09c75fe7acf756bf7c13efadf38aa0aca
    Port:           <none>
    State:          Waiting
      Reason:       CrashLoopBackOff
    Last State:     Terminated
      Reason:       Error
      Exit Code:    1
      Started:      Tue, 27 Mar 2018 19:13:15 +0200
      Finished:     Tue, 27 Mar 2018 19:13:16 +0200
    Ready:          False
    Restart Count:  4
    Environment:    <none>
    Mounts:
      /etc/nginx/nginx.conf from config (rw)
      /var/run/secrets/kubernetes.io/serviceaccount from default-token-chcxn (ro)
Conditions:
  Type           Status
  Initialized    True
  Ready          False
  PodScheduled   True
Volumes:
  config:
    Type:      ConfigMap (a volume populated by a ConfigMap)
    Name:      nginxconfig
    Optional:  false
  default-token-chcxn:
    Type:        Secret (a volume populated by a Secret)
    SecretName:  default-token-chcxn
    Optional:    false
QoS Class:       BestEffort
Node-Selectors:  nginxcrash=allowed
Tolerations:     node.alpha.kubernetes.io/notReady:NoExecute for 300s
                 node.alpha.kubernetes.io/unreachable:NoExecute for 300s
Events:
  Type     Reason                 Age               From                                               Message
  ----     ------                 ----              ----                                               -------
  Normal   Scheduled              2m                default-scheduler                                  Successfully assigned nginx-5796d5bc7c-xsl6p to ip-10-0-9-132.us-east-2.compute.internal
  Normal   SuccessfulMountVolume  2m                kubelet, ip-10-0-9-132.us-east-2.compute.internal  MountVolume.SetUp succeeded for volume "config"
  Normal   SuccessfulMountVolume  2m                kubelet, ip-10-0-9-132.us-east-2.compute.internal  MountVolume.SetUp succeeded for volume "default-token-chcxn"
  Normal   Pulled                 1m (x3 over 2m)   kubelet, ip-10-0-9-132.us-east-2.compute.internal  Successfully pulled image "nginx"
  Normal   Created                1m (x3 over 2m)   kubelet, ip-10-0-9-132.us-east-2.compute.internal  Created container
  Normal   Started                1m (x3 over 2m)   kubelet, ip-10-0-9-132.us-east-2.compute.internal  Started container
  Warning  BackOff                1m (x5 over 1m)   kubelet, ip-10-0-9-132.us-east-2.compute.internal  Back-off restarting failed container
  Warning  FailedSync             1m (x5 over 1m)   kubelet, ip-10-0-9-132.us-east-2.compute.internal  Error syncing pod
  Normal   Pulling                57s (x4 over 2m)  kubelet, ip-10-0-9-132.us-east-2.compute.internal  pulling image "nginx"
How to alert, troubleshoot and fix #Kubernetes CrashLoopBackOff events
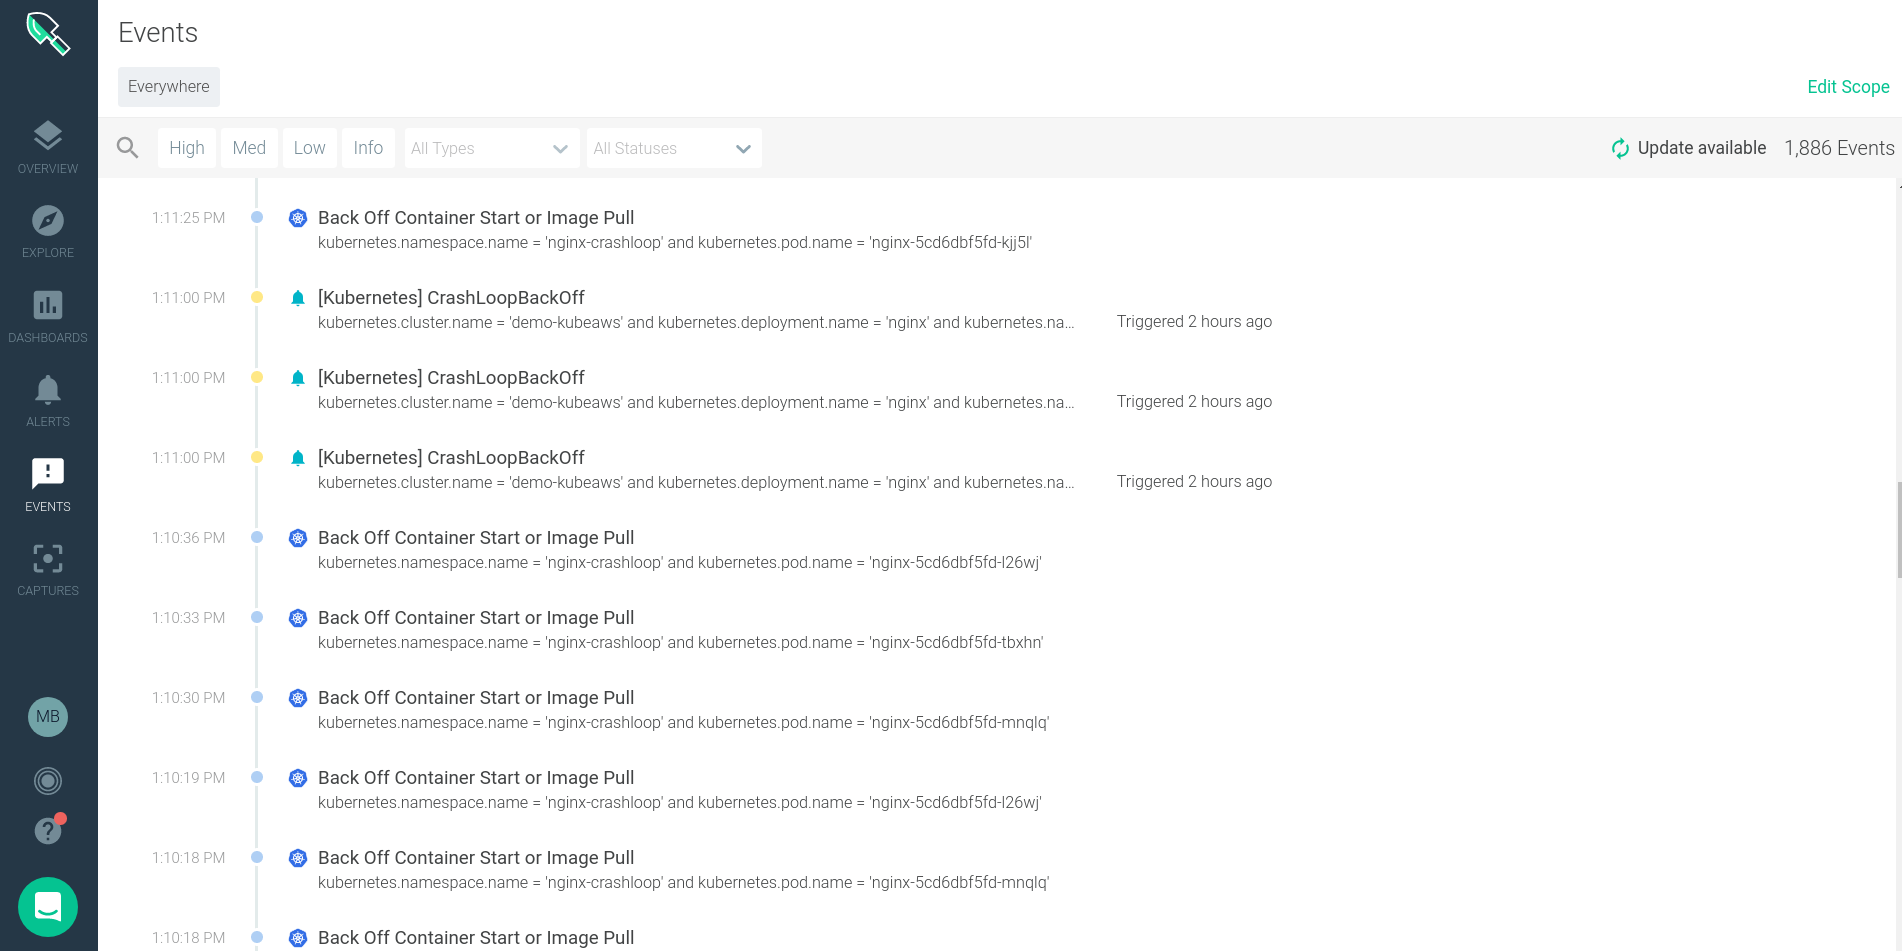
Visualizing Kubernetes events in Sysdig Monitor
CrashLoopBackOff events can be viewed through Sysdig Monitor on the events tab. Sysdig Monitor will natively ingest both Kubernetes and Docker events for users alert on, and overlay on charts of the system performance.
Kubernetes Events Ingested by Sysdig
kubernetes:
    node:
      - TerminatedAllPods       # Terminated All Pods      (information)
      - RegisteredNode          # Node Registered          (information)*
      - RemovingNode            # Removing Node            (information)*
      - DeletingNode            # Deleting Node            (information)*
      - DeletingAllPods         # Deleting All Pods        (information)
      - TerminatingEvictedPod   # Terminating Evicted Pod  (information)*
      - NodeReady               # Node Ready               (information)*
      - NodeNotReady            # Node not Ready           (information)*
      - NodeSchedulable         # Node is Schedulable      (information)*
      - NodeNotSchedulable      # Node is not Schedulable  (information)*
      - CIDRNotAvailable        # CIDR not Available       (information)*
      - CIDRAssignmentFailed    # CIDR Assignment Failed   (information)*
      - Starting                # Starting Kubelet         (information)*
      - KubeletSetupFailed      # Kubelet Setup Failed     (warning)*
      - FailedMount             # Volume Mount Failed      (warning)*
      - NodeSelectorMismatching # Node Selector Mismatch   (warning)*
      - InsufficientFreeCPU     # Insufficient Free CPU    (warning)*
      - InsufficientFreeMemory  # Insufficient Free Mem    (warning)*
      - OutOfDisk               # Out of Disk              (information)*
      - HostNetworkNotSupported # Host Ntw not Supported   (warning)*
      - NilShaper               # Undefined Shaper         (warning)*
      - Rebooted                # Node Rebooted            (warning)*
      - NodeHasSufficientDisk   # Node Has Sufficient Disk (information)*
      - NodeOutOfDisk           # Node Out of Disk Space   (information)*
      - InvalidDiskCapacity     # Invalid Disk Capacity    (warning)*
      - FreeDiskSpaceFailed     # Free Disk Space Failed   (warning)*
    pod:
      - Pulling           # Pulling Container Image          (information)
      - Pulled            # Ctr Img Pulled                   (information)
      - Failed            # Ctr Img Pull/Create/Start Fail   (warning)*
      - InspectFailed     # Ctr Img Inspect Failed           (warning)*
      - ErrImageNeverPull # Ctr Img NeverPull Policy Violate (warning)*
      - BackOff           # Back Off Ctr Start, Image Pull   (warning)
      - Created           # Container Created                (information)
      - Started           # Container Started                (information)
      - Killing           # Killing Container                (information)*
      - Unhealthy         # Container Unhealthy              (warning)
      - FailedSync        # Pod Sync Failed                  (warning)
      - FailedValidation  # Failed Pod Config Validation     (warning)
      - OutOfDisk         # Out of Disk                      (information)*
      - HostPortConflict  # Host/Port Conflict               (warning)*
    replicationController:
      - SuccessfulCreate    # Pod Created        (information)*
      - FailedCreate        # Pod Create Failed  (warning)*
      - SuccessfulDelete    # Pod Deleted        (information)*
      - FailedDelete        # Pod Delete Failed  (warning)*
Custom events can be sent into the Sysdig Monitor events API to be used for correlation and alerting as well. For example you can send a custom event when you run a new deployment from Jenkins, when you do a roll-back of a broken version or when your cloud infrastructure changes.
The custom events section of Sysdig Monitor gives us a feed of all events that have happened across my distributed Kubernetes environment. Here we can see the timestamp, event name, description, severity and other details.
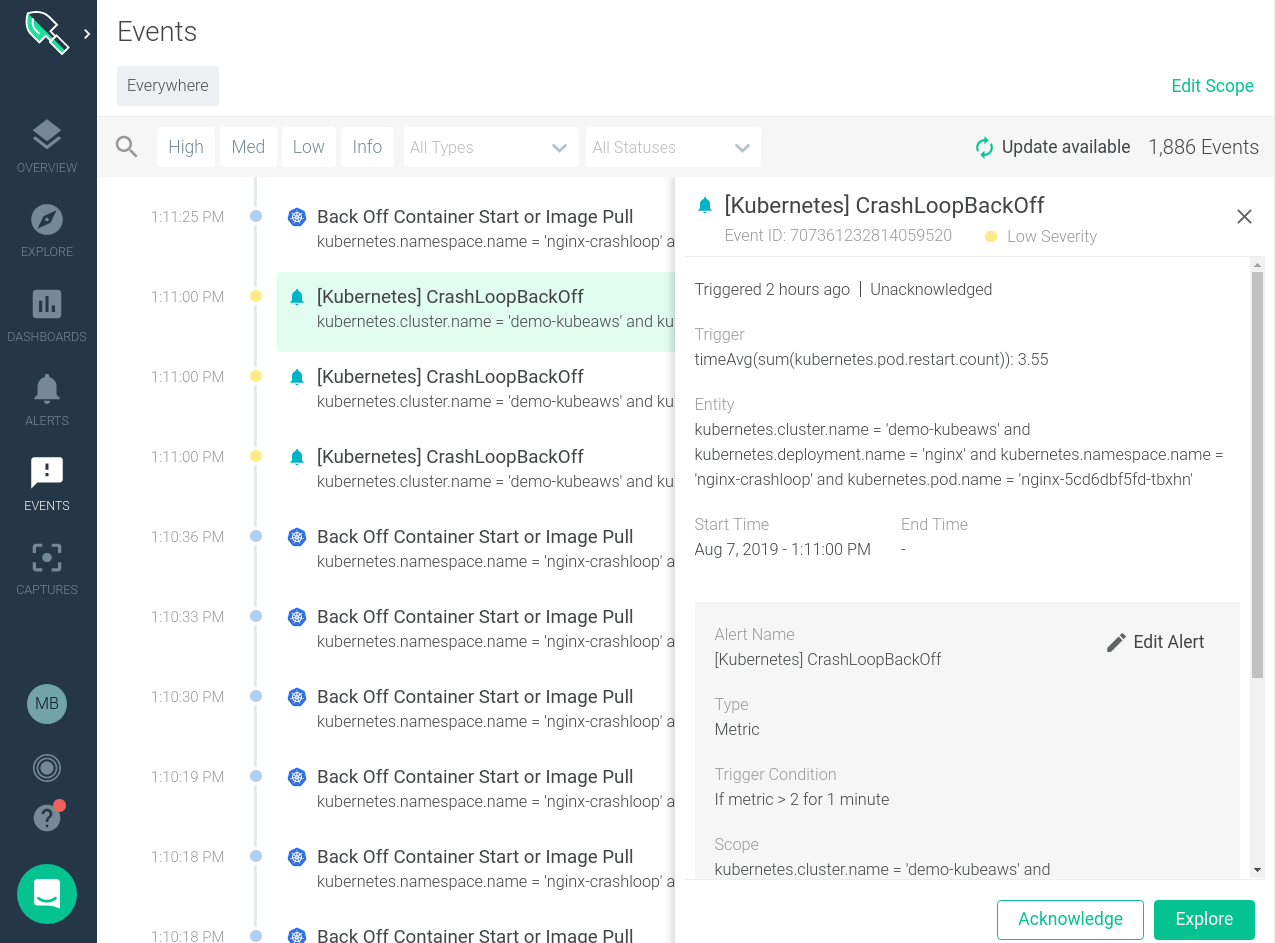
Clicking on an individual event brings up further details about that specific event and more granular details about where it occurred in our infrastructure.
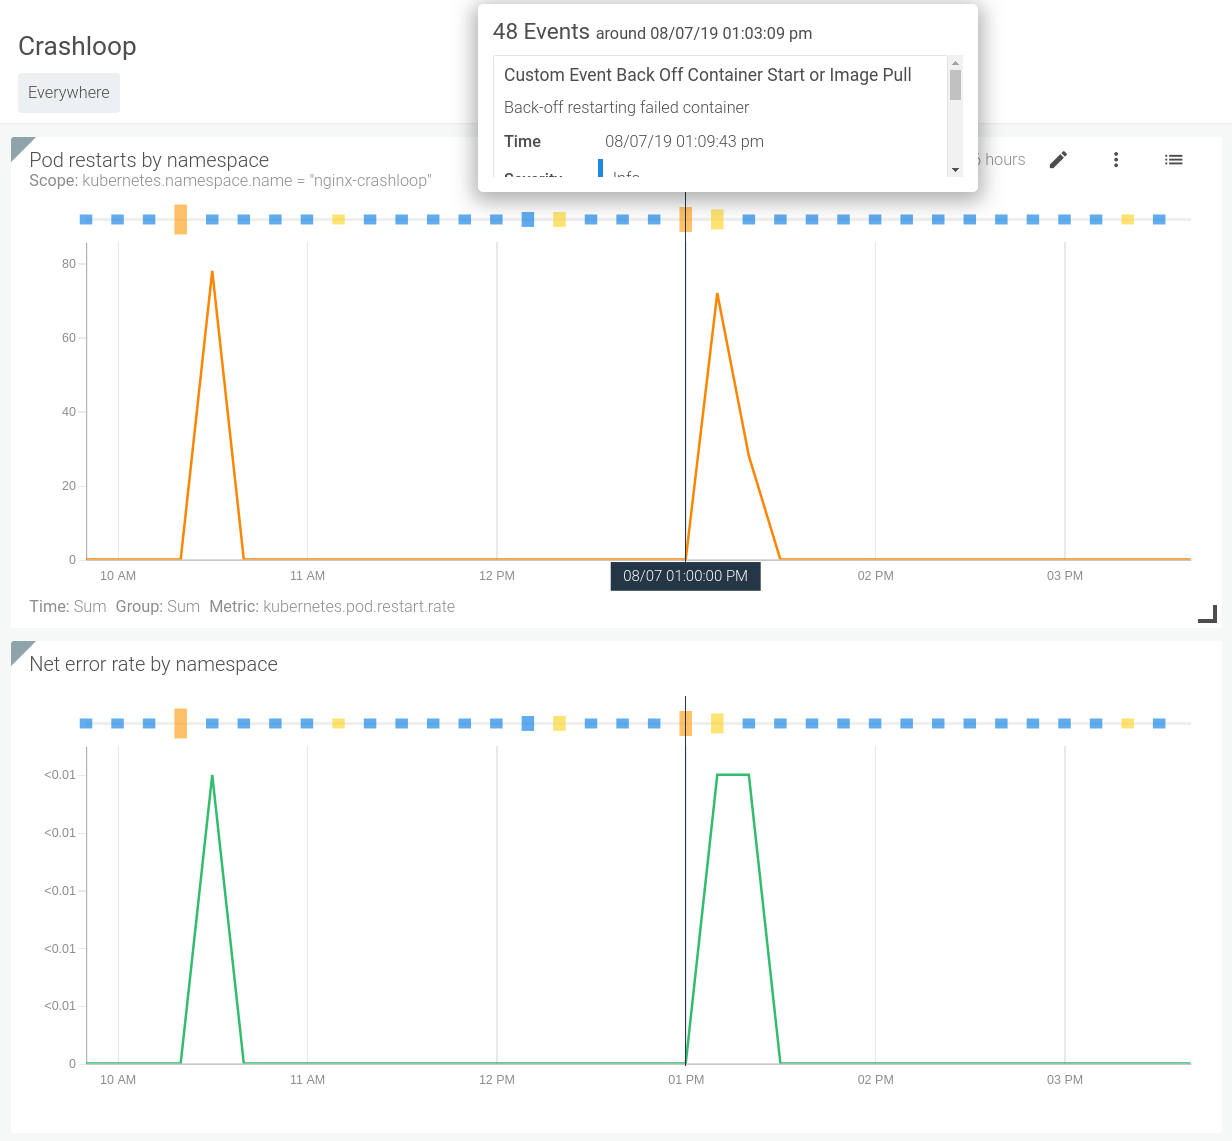
We can also correlate these events with the behavior of our systems. Looking at the image below we can quickly see when a specific backoff event occurred and if it caused and change to the performance of the system.
How to alert on Kubernetes CrashLoopBackOff
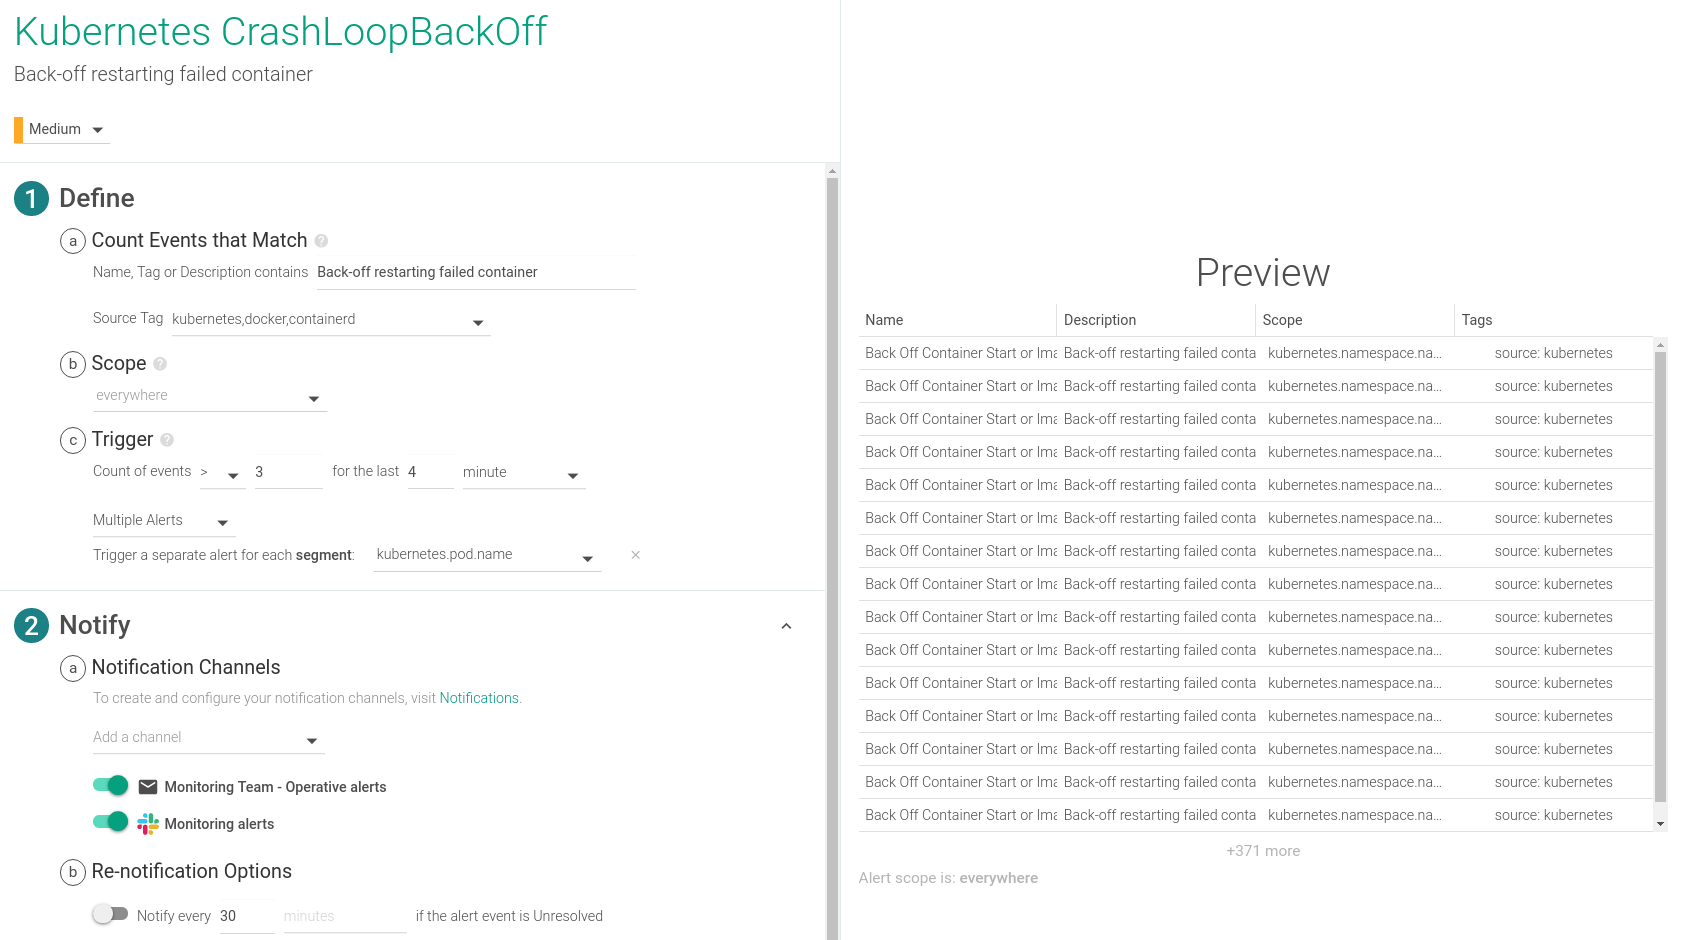
For alerting purposes we’ll want to use the metric kubernetes.pod.restart.rate. This will give us the ability to do analysis on the trend of pod restarts over time, and promptly notify our team of any anomalies.
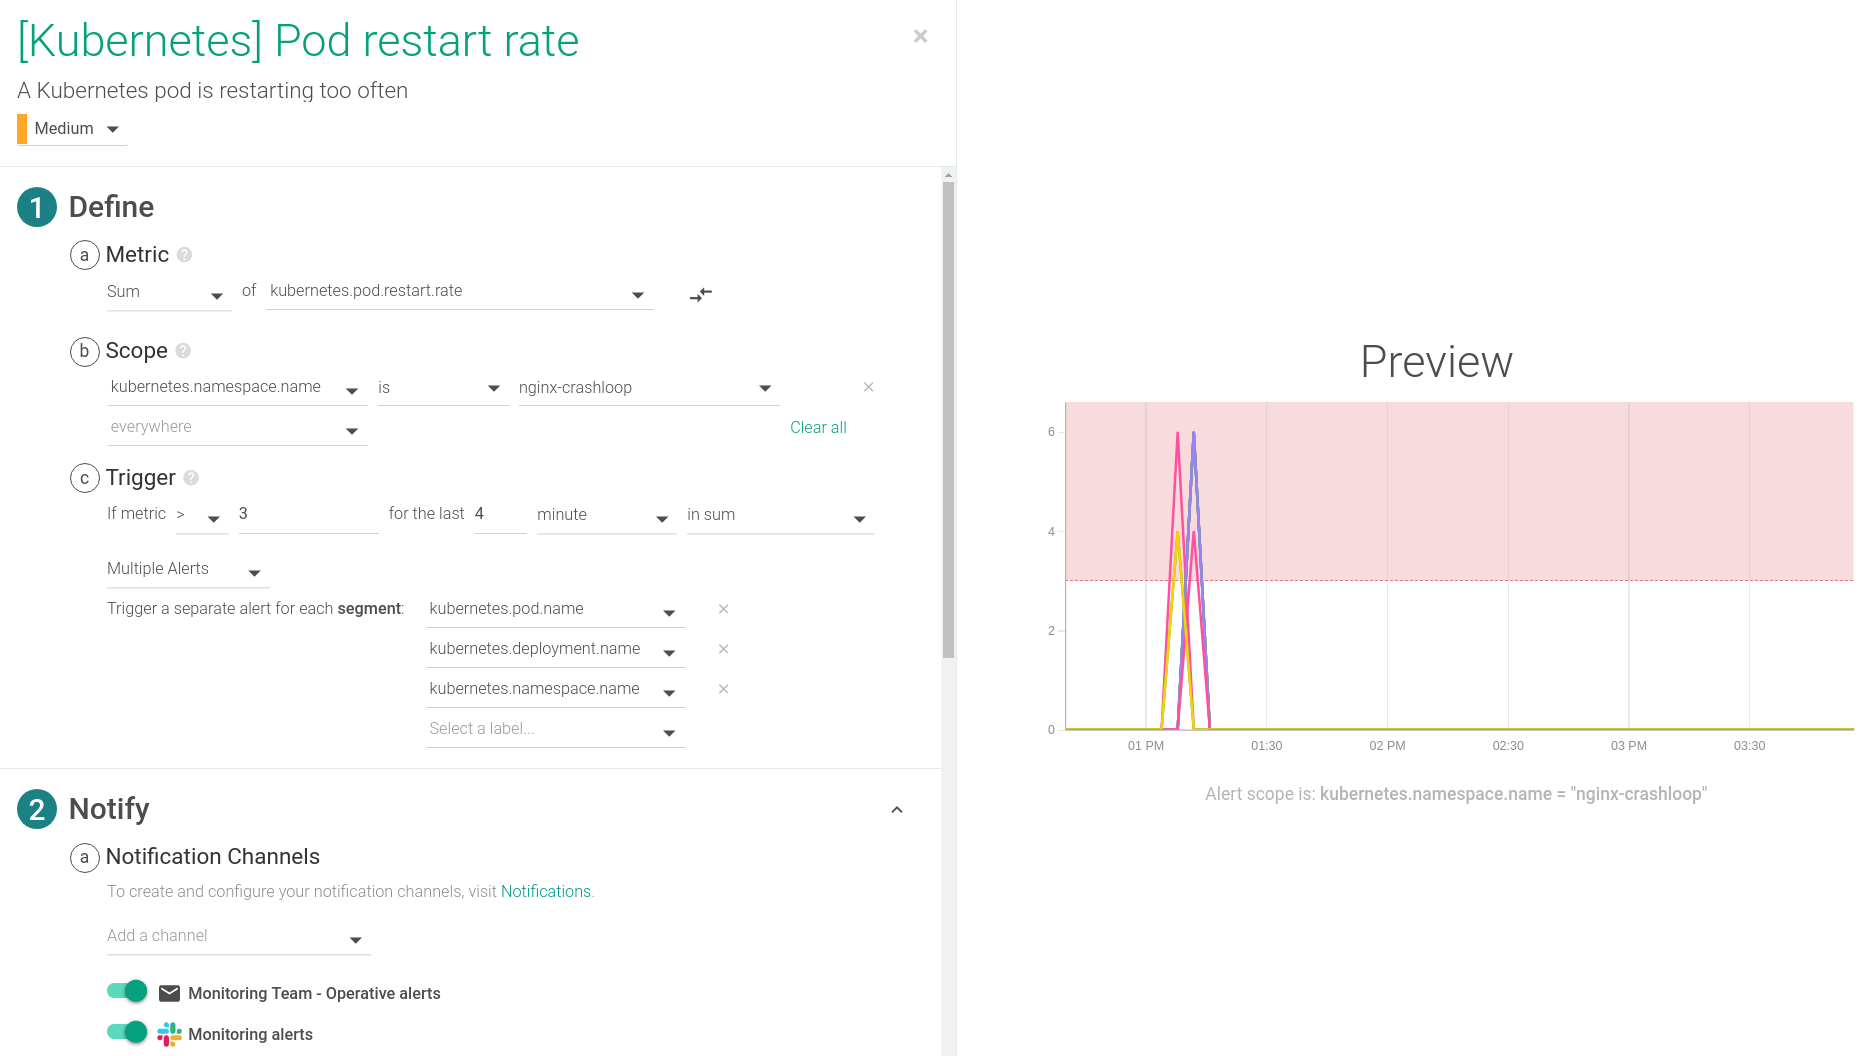
Depending on the delay in your environment you’ll want to toggle the time settings. This alert is configured to trigger if any pod restarts more than 3 times over a 4 minute span, which is usually an indicator of a CrashLoopBackOff event. This alert is one of the default alerts for Kubernetes environments.
Enabling a Sysdig Capture is also very important for the troubleshooting of a CrashLoopBackOff. A Sysdig capture is a full recording of everything that happened on the system at the point in time when an alert triggered. Captures can be opened with Sysdig Inspect for deep forensic and troubleshooting analysis so teams can respond and recover from incidents quicker.
In a similar fashion, you can also configure a CrashLoopBackOff alert based on the events that Sysdig collects:
How to debug / troubleshoot and fix Kubernetes CrashLoopBackOff
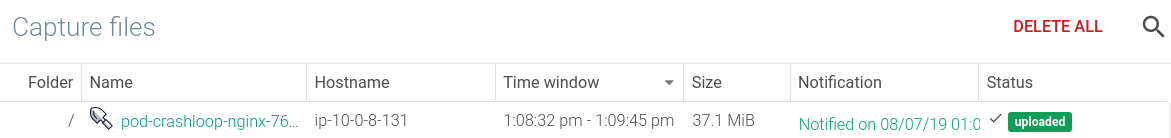
You can manually trigger a Sysdig capture at any point in time by selecting the host where you see the CrashLoopBackOff is occurring and starting the capture. You can take it manually with Sysdig open source if you have it installed on that host. But here will take advantage of the Sysdig Monitor capabilities that can automatically take this capture file as a response to an alert, in this case a CrashLoopBackOff alert.
The first troubleshooting action item is to open the capture file that was recorded at the point in time that the event was happening on the host.
When a capture is opened in Sysdig Monitor a browser window will pop up with Sysdig Inspect. Inspect allows you to do system call analysis through a GUI for more efficient correlation and troubleshooting analysis. Within the scope of our Sysdig Secure, our container run-time security product, Sysdig Inspect is used for post-mortem analysis and forensics.
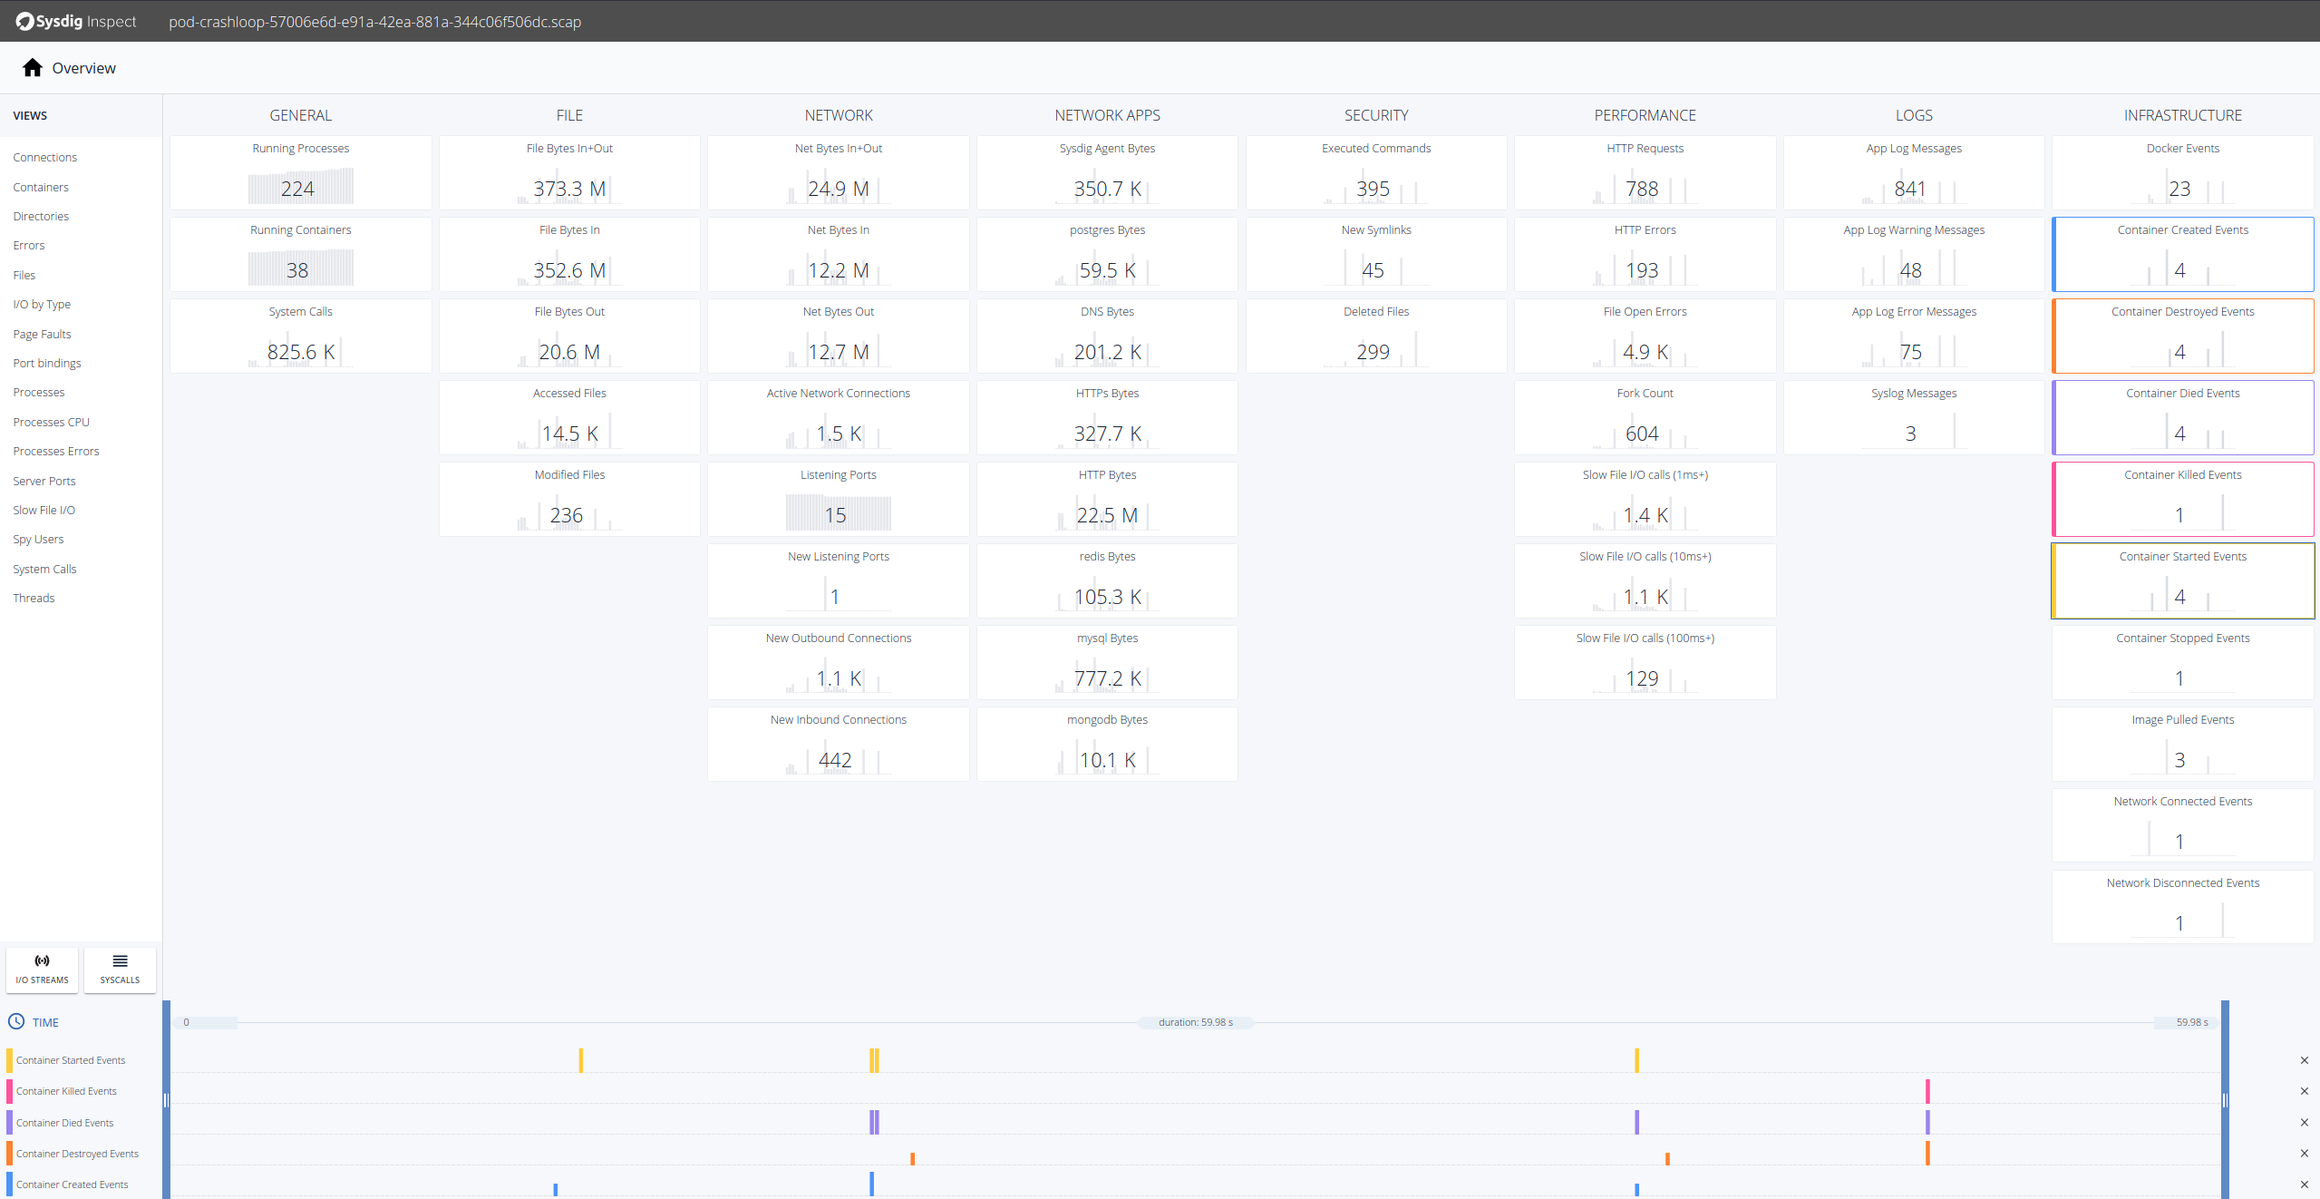
To troubleshoot this event we’ll want to look at everything that is occurring the infrastructure column of Sysdig Inspect. Selecting the Docker Events tiles will bring those events into the timeline at the bottom.
Let’s try to troubleshoot what’s going on here. A good first step is to drill down into Container Died Events.
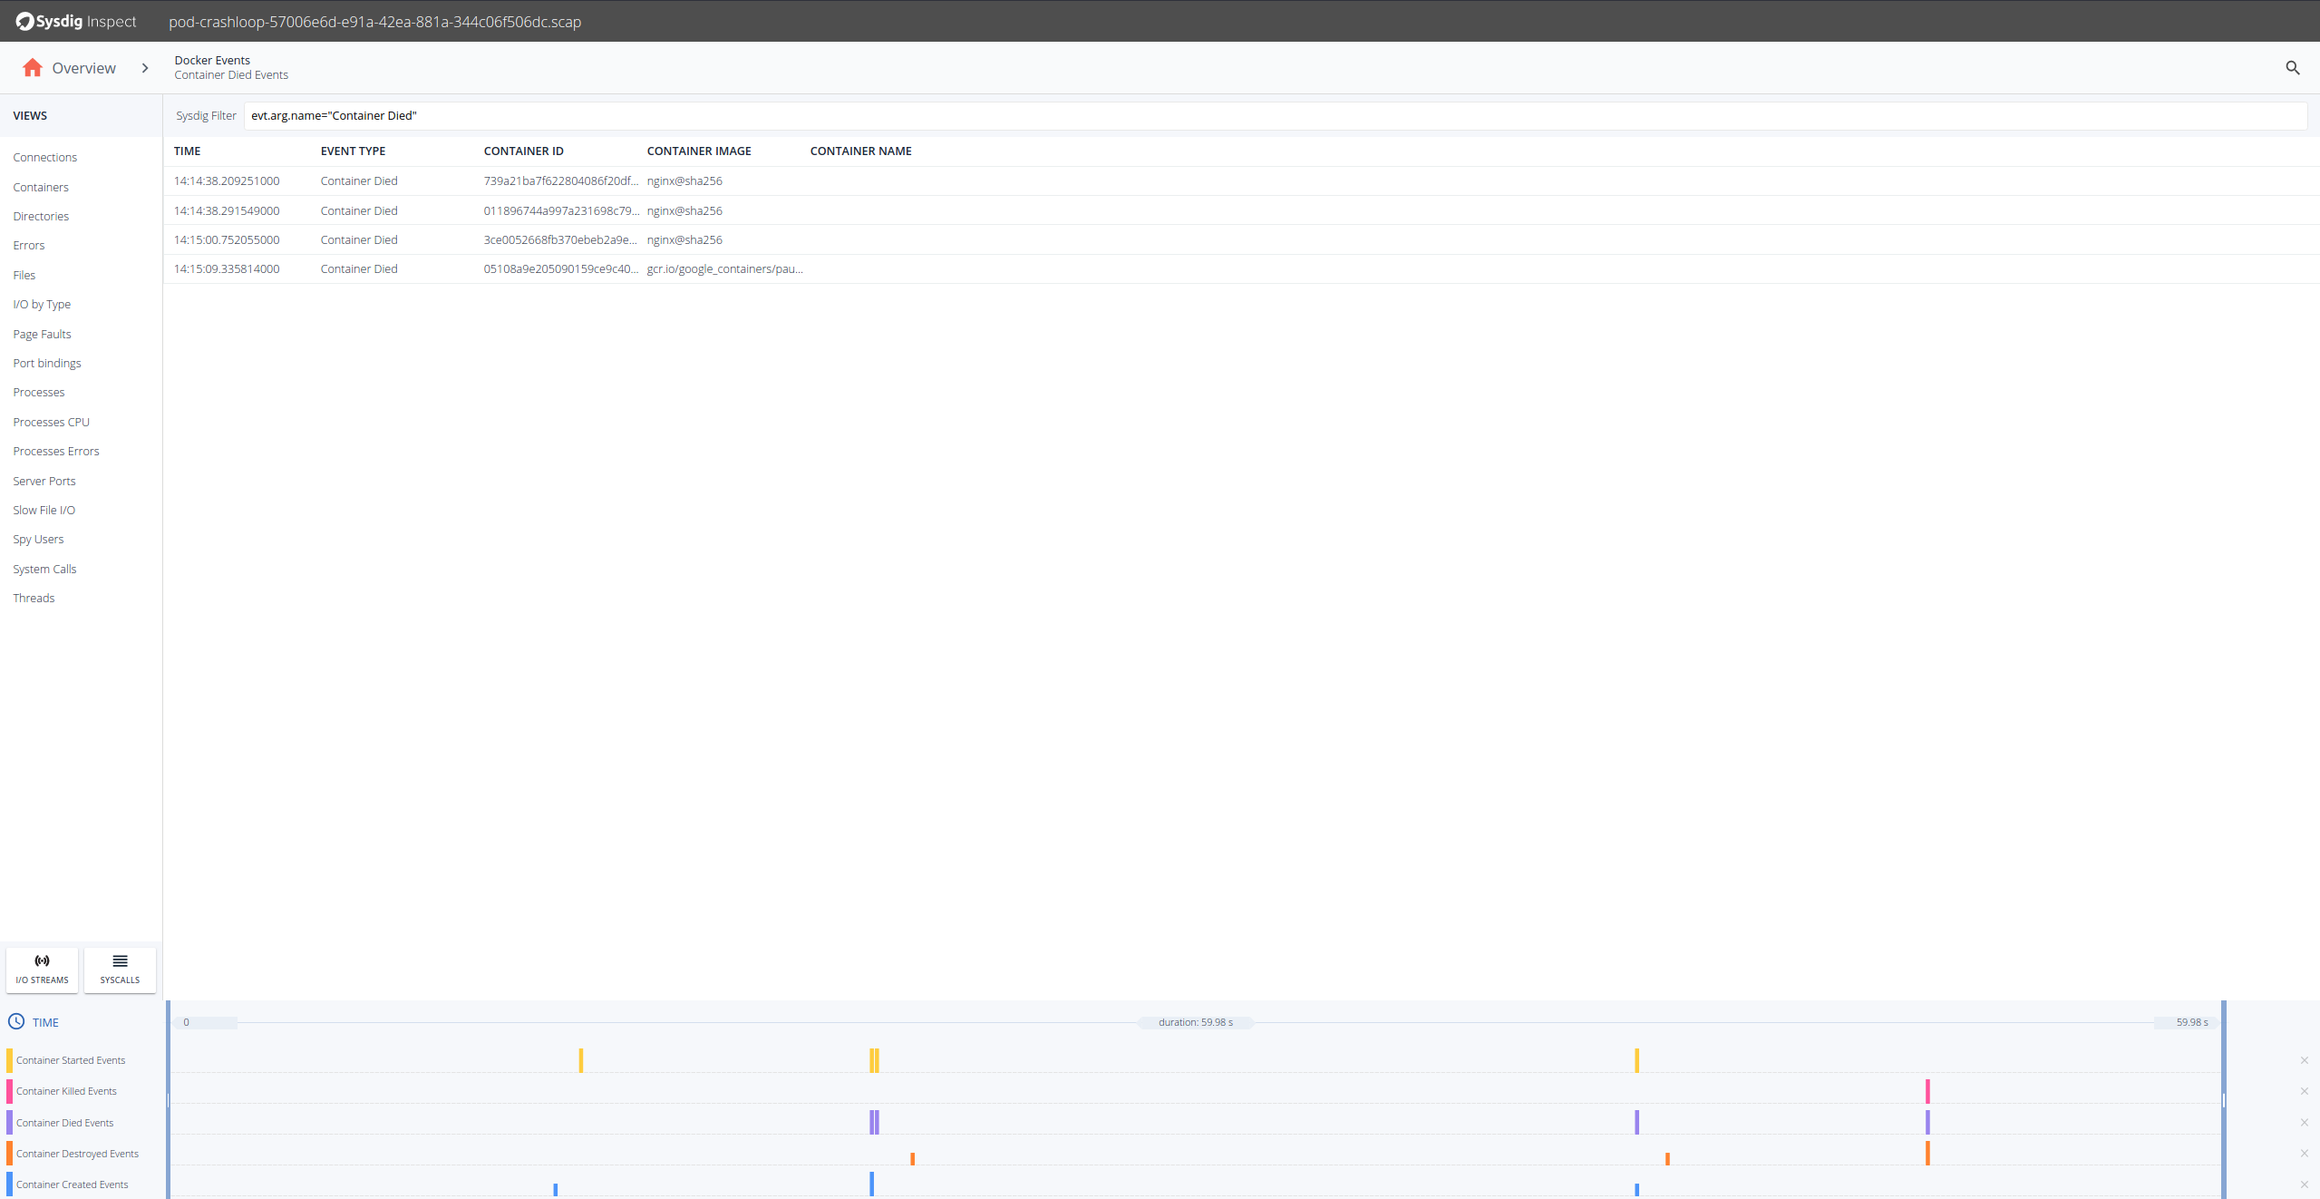
OK, so it seems that the Nginx containers are having trouble. Looking at the timestamps they die shortly after being created. Let’s drill down in any of the Nginx containers and there select Processes on the left hand side.
We know our Nginx container only executes one process “nginx” so from the Processes filter by proc.name = nginx.
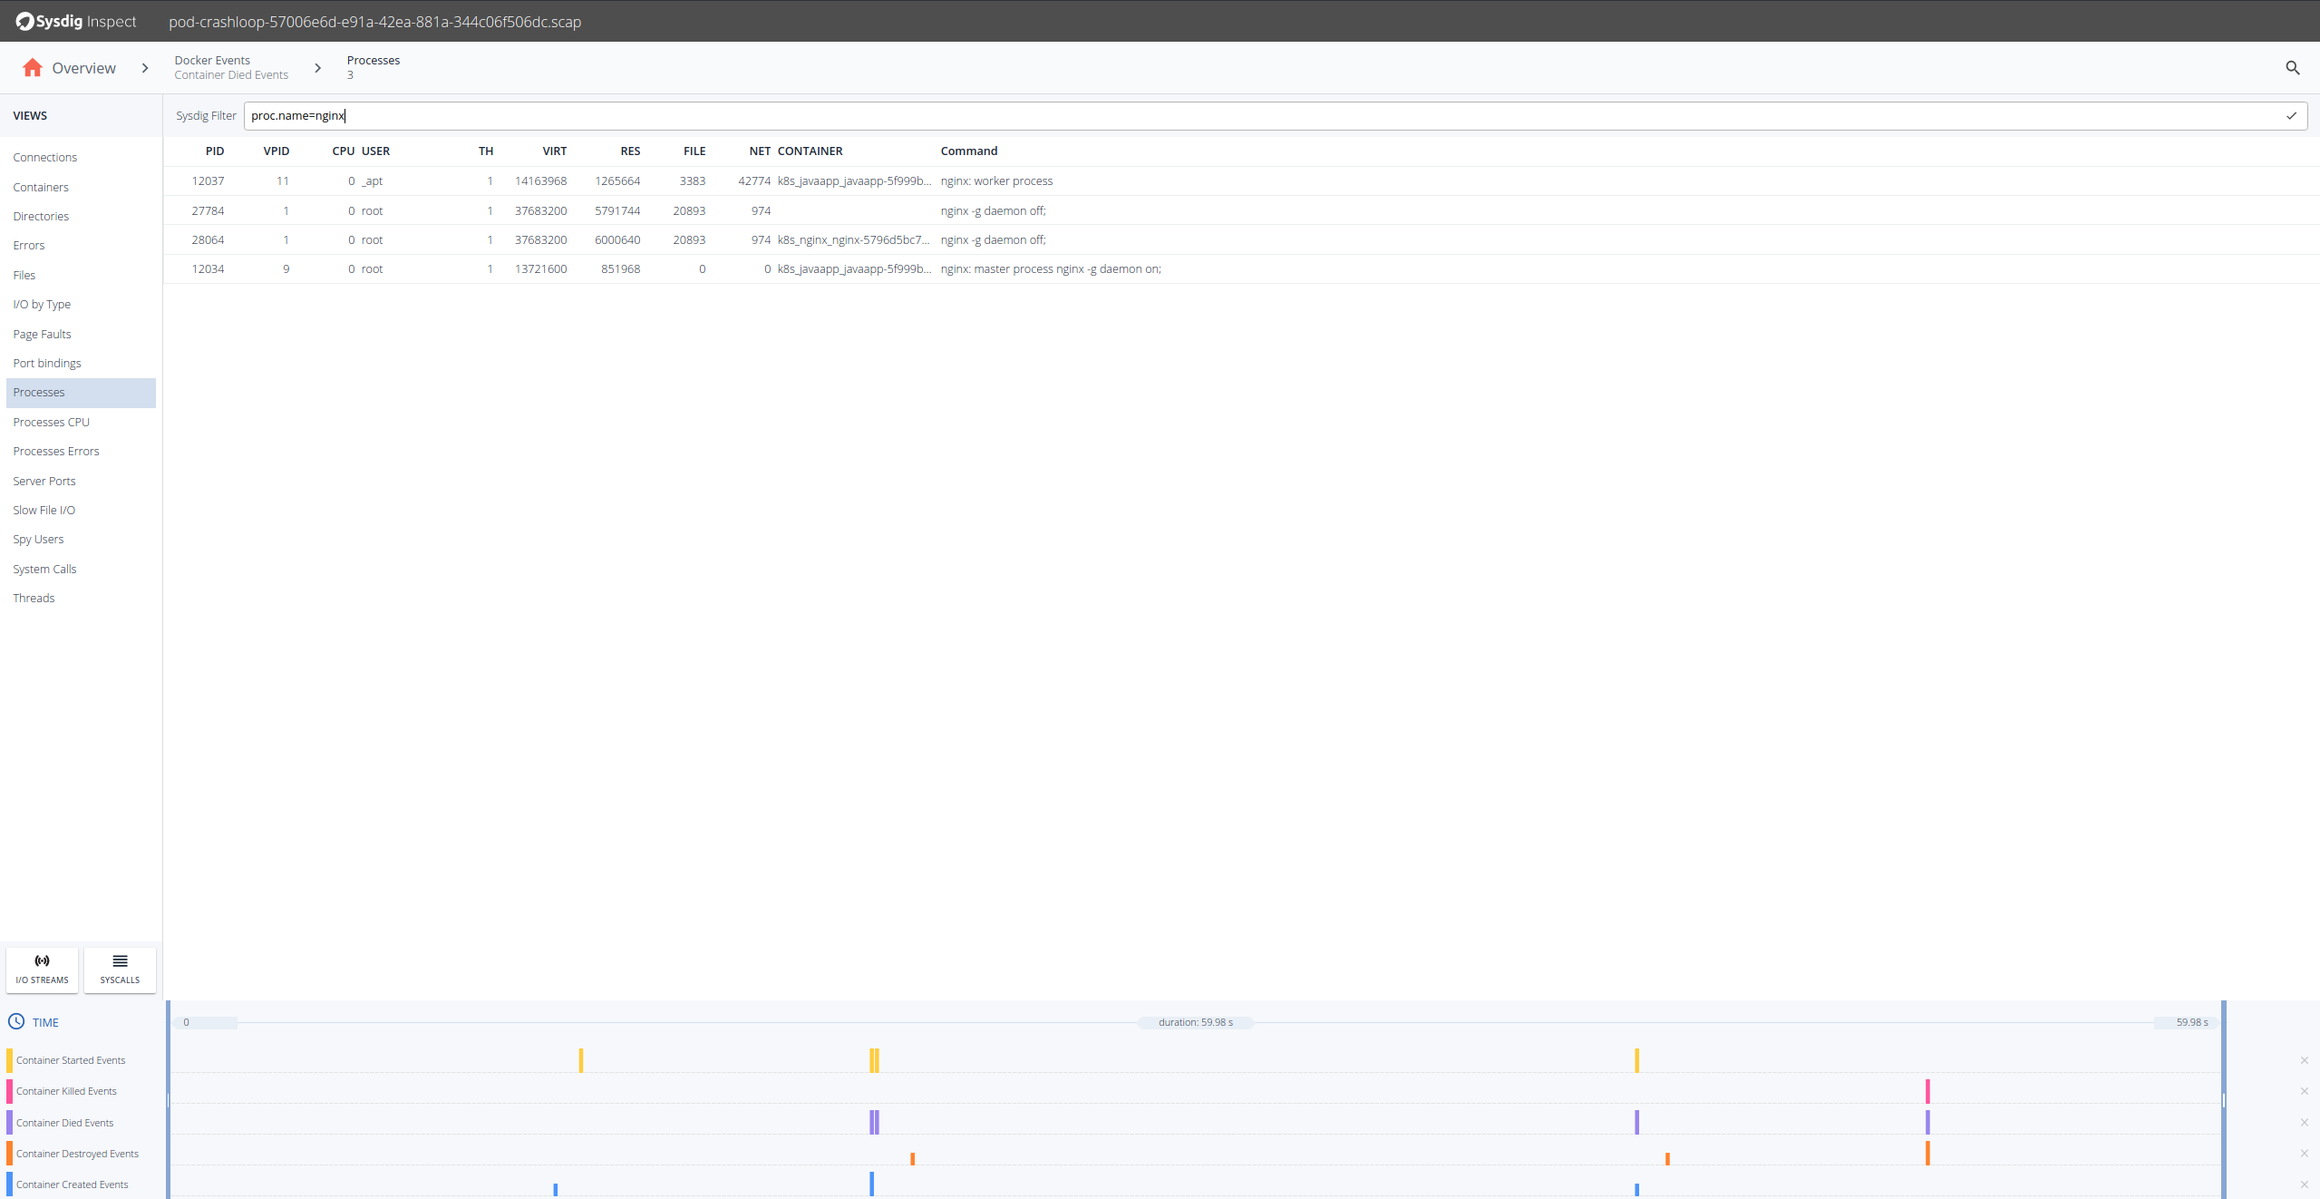
Sysdig Inspect filters use the Sysdig open-source syntax and can be used to pinpoint activity.
We can click on the Errors section, but nothing significant appears there, no failed system calls. Let’s move into the Files section to inspect file system activity. There will see a error.log file, that probably has some information for us. We can see its I/O activity clicking on the I/O Streams icon.
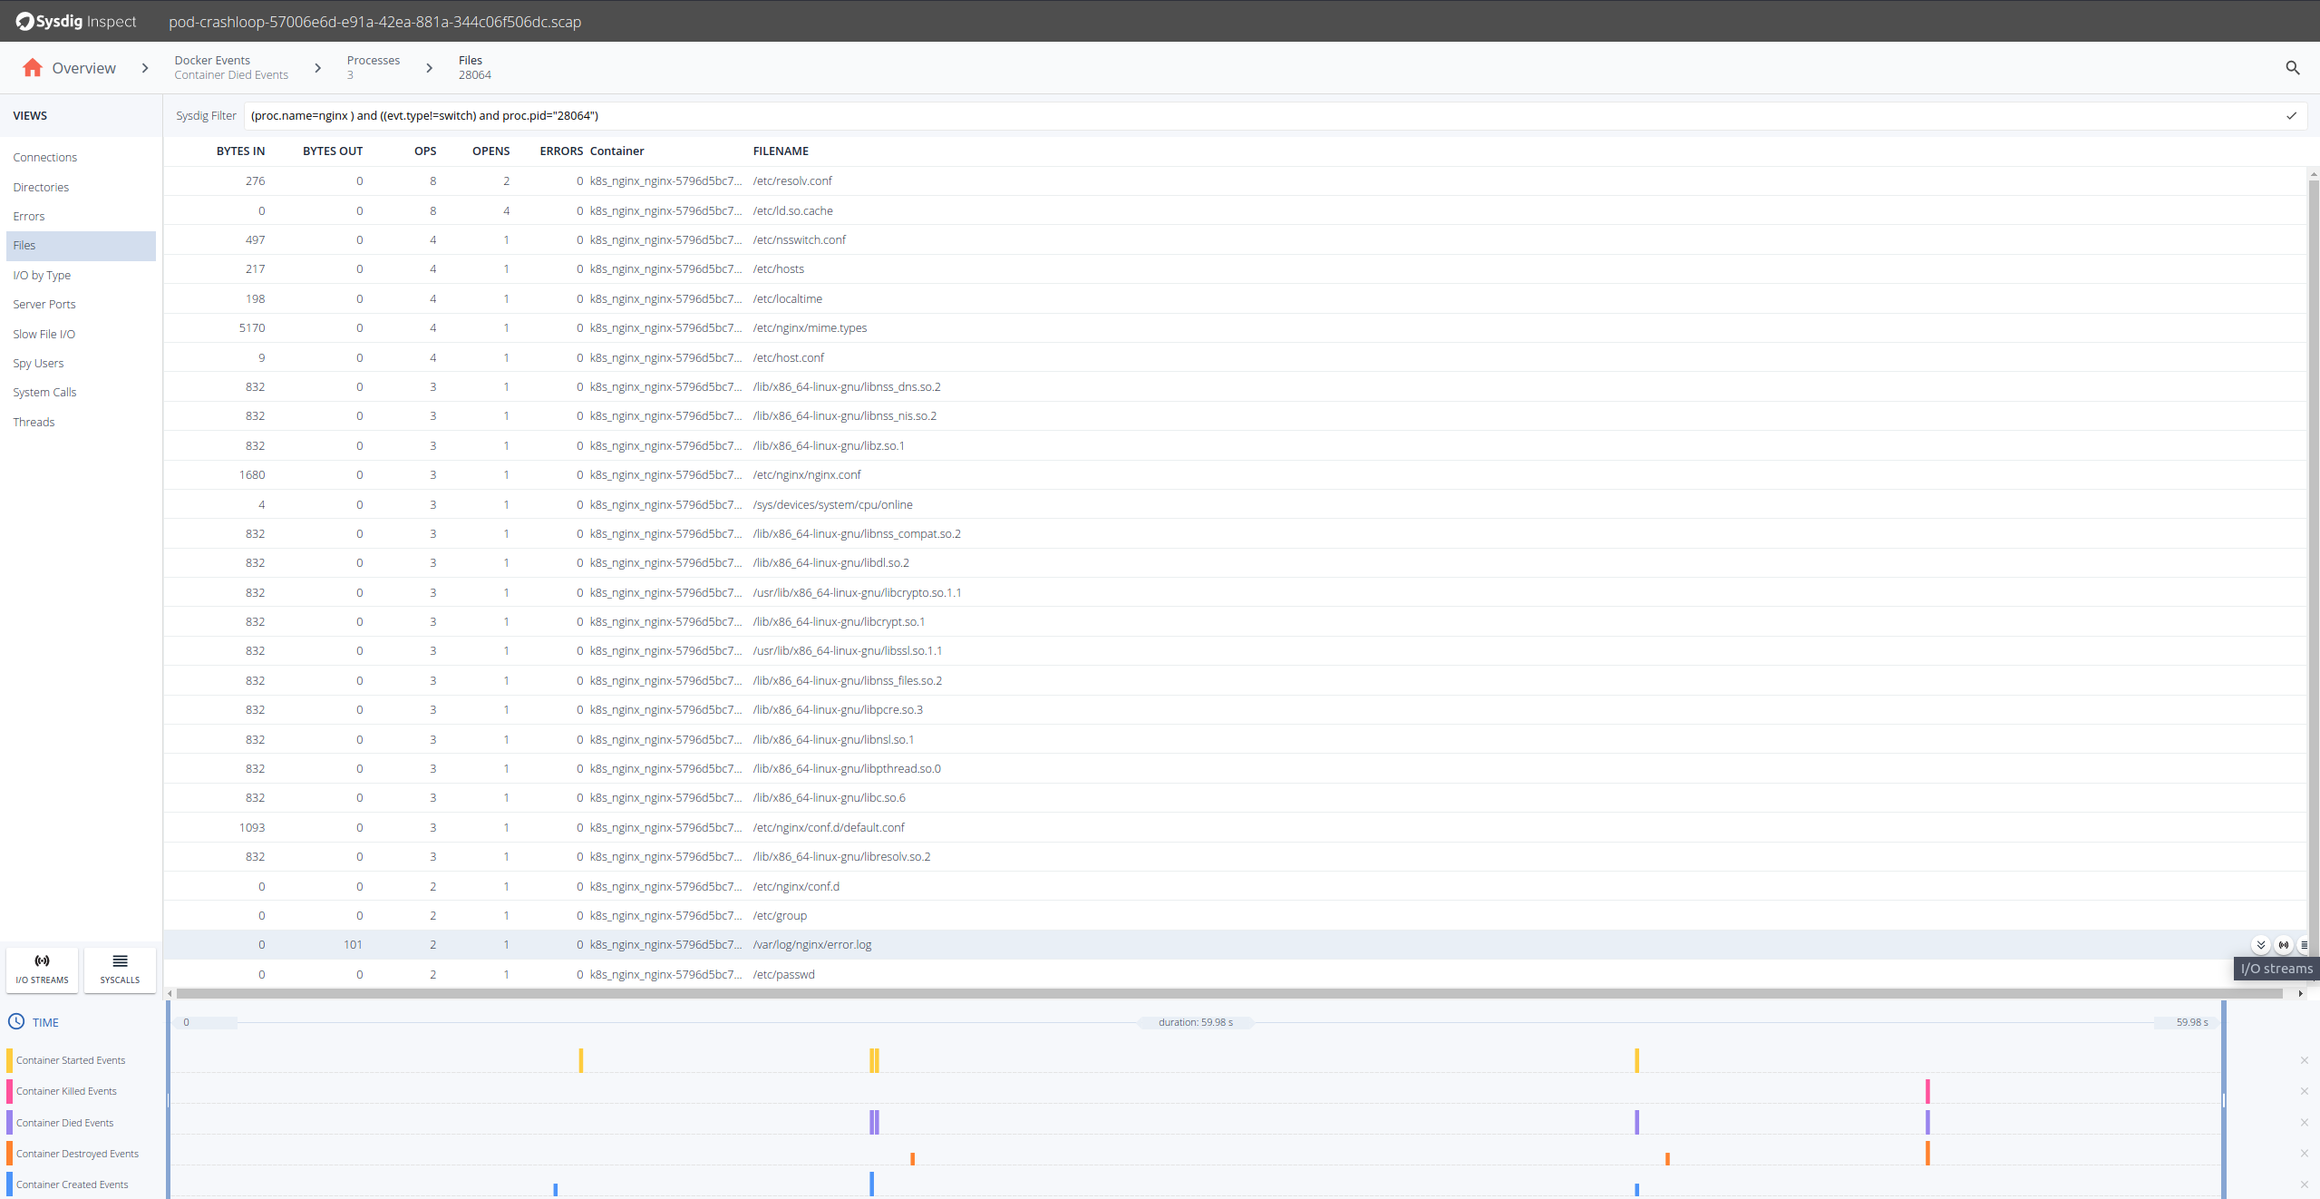
So from the content written in the error.log file until the container died, appears that Nginx cannot resolve a configured upstream server. We know why the Nginx fails, but can we look at what was the configured DNS server for that pod? Sure, just go back and get the streams for resolv.conf.


From here we can go even further and look at the DNS requests 53/UDP, and seems that the response was not found. This gives us further troubleshooting clues: we deployed the Nginx ReplicaSets first and the upstream Kubernetes service later. Nginx has a particularity, it caches the proxy names (like “flask”) at startup time, not upon client request. In other words, we have deployed the different Kubernetes entities in the wrong dependency order.
Conclusion
While something like a pod restarting is an easy thing to spot, responding and recovering quickly from a potential degradation in a production service can be much harder, especially when the logs from the container are gone, you cannot reproduce the problem outside a specific environment or you just don’t have the troubleshooting tools inside the container.
This is why further troubleshooting preparations like Sysdig captures are needed. They provide full container context and complete visibility to any interprocess communication, files written, and network activity. Like a time machine! Troubleshooting at the syscall level can be tricky but now with Sysdig Inspect it’s a breeze!
Post navigation