<template>
<div>
<div id="rightCenterChart" style="width:6.75rem;height:3.875rem;"></div>
</div>
</template>
<script>
const echarts = require("echarts");
export default {
data() {
return {};
},
mounted() {
this.drawPie();
},
methods: {
drawPie() {
// 基于准备好的dom,初始化echarts实例
let myChartRightCenter = echarts.init(
document.getElementById("rightCenterChart")
);
let option = {
legend: {
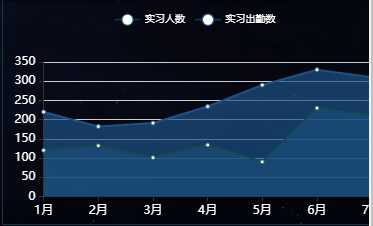
data: ['实习人数', '实习出勤数'],
top:'3%',
textStyle: { //图例文字的样式
color: '#fff',
fontSize: 10,
},
},
grid: {
left: '3%',
right: '4%',
bottom: '3%',
containLabel: true
},
xAxis: [{
type: 'category',
boundaryGap: false,
data: ['1月', '2月', '3月', '4月', '5月', '6月', '7月'],
axisLabel: {
textStyle: {
color: '#ffffff', //坐标的字体颜色
},
},
}],
yAxis: [{
type: 'value',
axisLabel: {
textStyle: {
color: '#ffffff', //坐标的字体颜色
},
},
}],
series: [{
name: '实习人数',
type: 'line',
areaStyle: {},
data: [120, 132, 101, 134, 90, 230, 210],
color:'#144955',
},
{
name: '实习出勤数',
type: 'line',
areaStyle: {},
data: [220, 182, 191, 234, 290, 330, 310],
color:'#1c5186',
}
]
};
myChartRightCenter.setOption(option);
// -----------------------------------------------------------------
// 响应式变化
window.addEventListener("resize", () => myChartRightCenter.resize(), false);
}
},
destroyed() {
window.onresize = null;
}
};
</script>