作者:张能凤
原文来源:https://tidb.net/blog/aa843cf0
测试说明
因资源有限,用的 3 台 SAS 盘低配机器混布的TiDB集群,先安装 TiDB v5.4.0 集群做测试,测试完成后拆掉该集群,再重搭 TiDB v6.0.0 集群做测试 。机器配置很差,非 TiDB 最佳性能测试数据,本测试结果仅供参考。谢谢。
PS:最佳性能测试数据详见官方的性能测试报告。
硬件配置
| Host | Role | 硬件配置 |
|---|---|---|
| 172.0.0.1 | TiDB1,PD1,TiKV1 | 12c 16G ,550G SAS盘 |
| 172.0.0.2 | TiDB2,PD2,TiKV2 | 12c 16G ,550G SAS盘 |
| 172.0.0.3 | TiDB3,PD3,TiKV3,alertmanager,grafana,prometheus | 24c 32G ,550G SAS盘 |
参数配置
两个版本使用相同的配置。
TiDB 参数配置
log.level: "error"
prepared-plan-cache.enabled: true
tikv-client.max-batch-wait-time: 2000000
TiKV 参数配置
    storage.scheduler-worker-pool-size: 5
    storage.block-cache.shared: true
    raftstore.store-pool-size: 3
    raftstore.apply-pool-size: 3
    raftstore.hibernate-regions: true
    rocksdb.defaultcf.force-consistency-checks: false
    rocksdb.lockcf.force-consistency-checks: false
    rocksdb.raftcf.force-consistency-checks: false
    rocksdb.writecf.force-consistency-checks: false
    rocksdb.max-background-jobs: 8
    raftdb.max-background-jobs: 4
    raftdb.allow-concurrent-memtable-write: true
    server.grpc-concurrency: 6
    readpool.storage.normal-concurrency: 10
    pessimistic-txn.pipelined: true
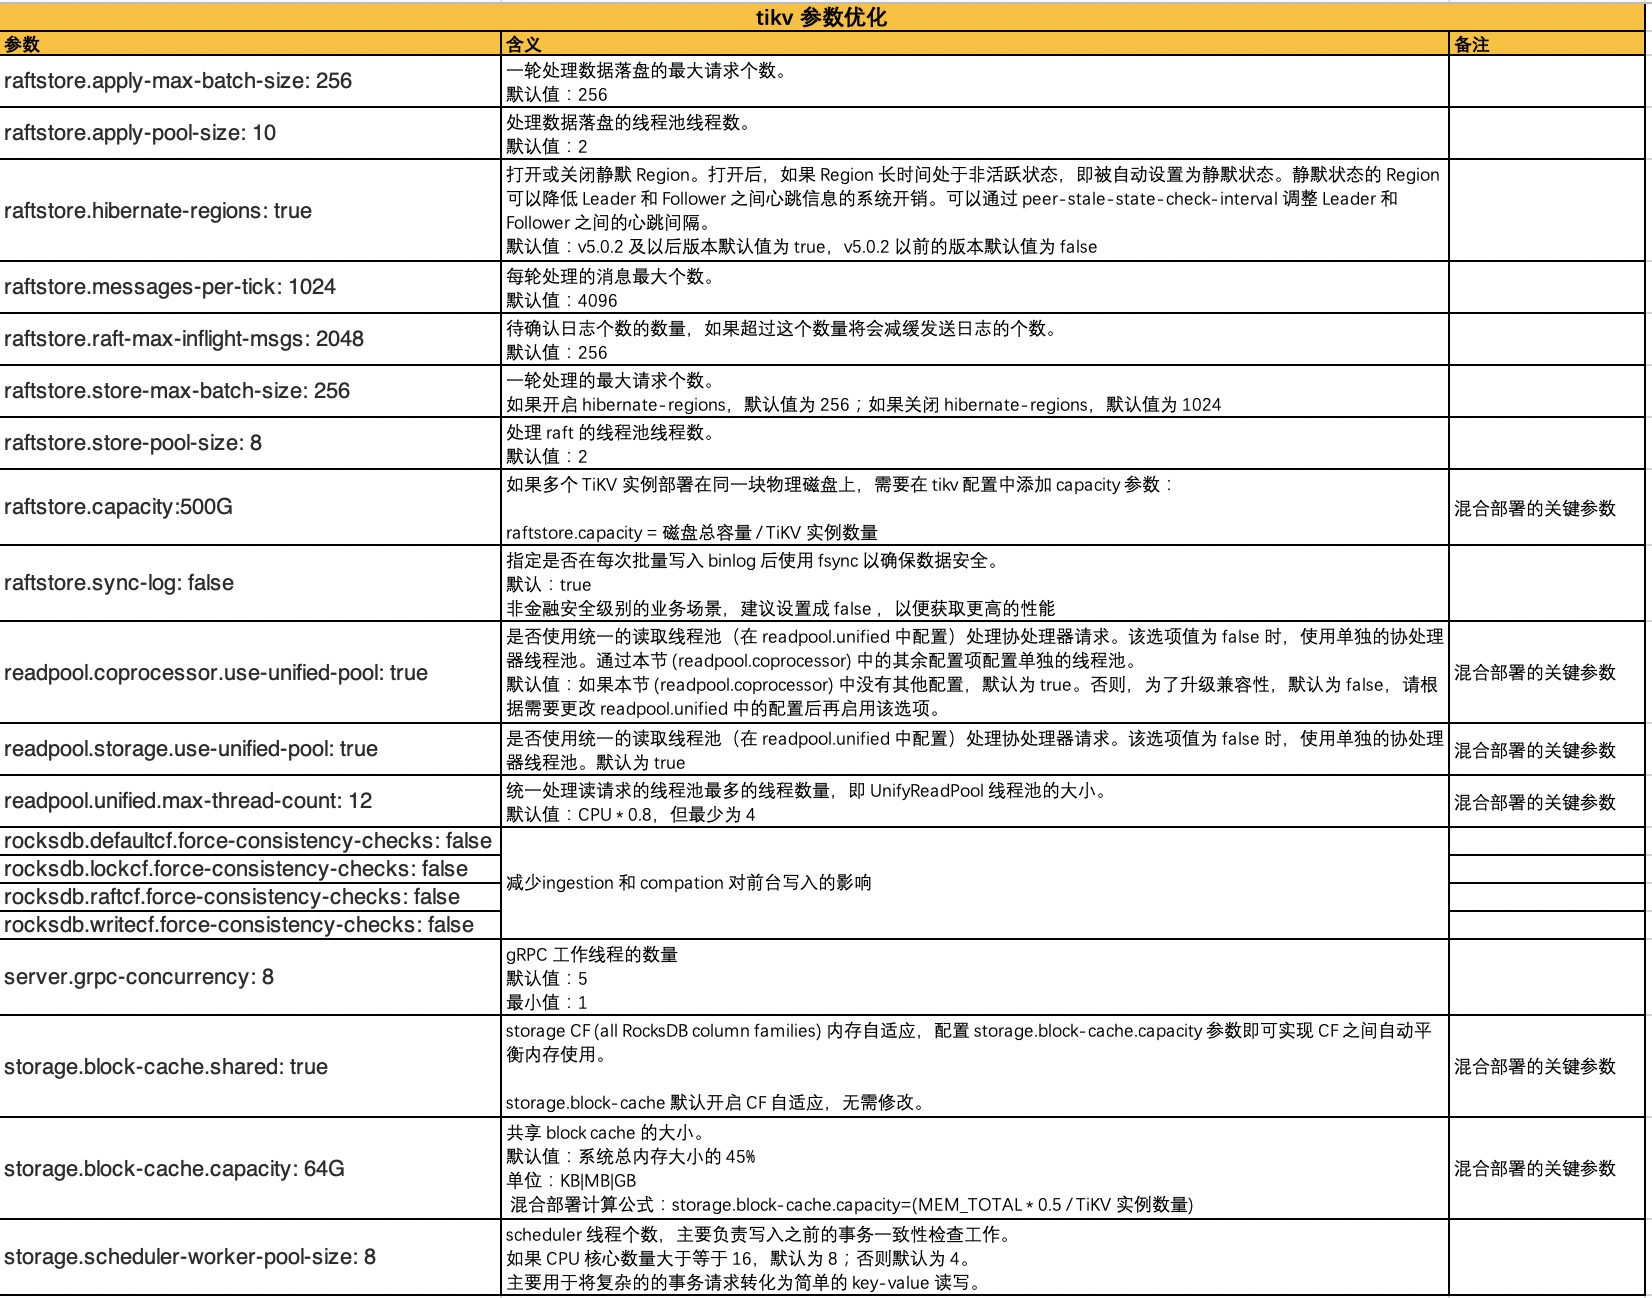
涉及的 tikv 参数说明
TiDB 全局变量配置
set global tidb_hashagg_final_concurrency=1;
set global tidb_hashagg_partial_concurrency=1;
set global tidb_enable_async_commit = 1;
set global tidb_enable_1pc = 1;
set global tidb_guarantee_linearizability = 0;
set global tidb_enable_clustered_index = 1;
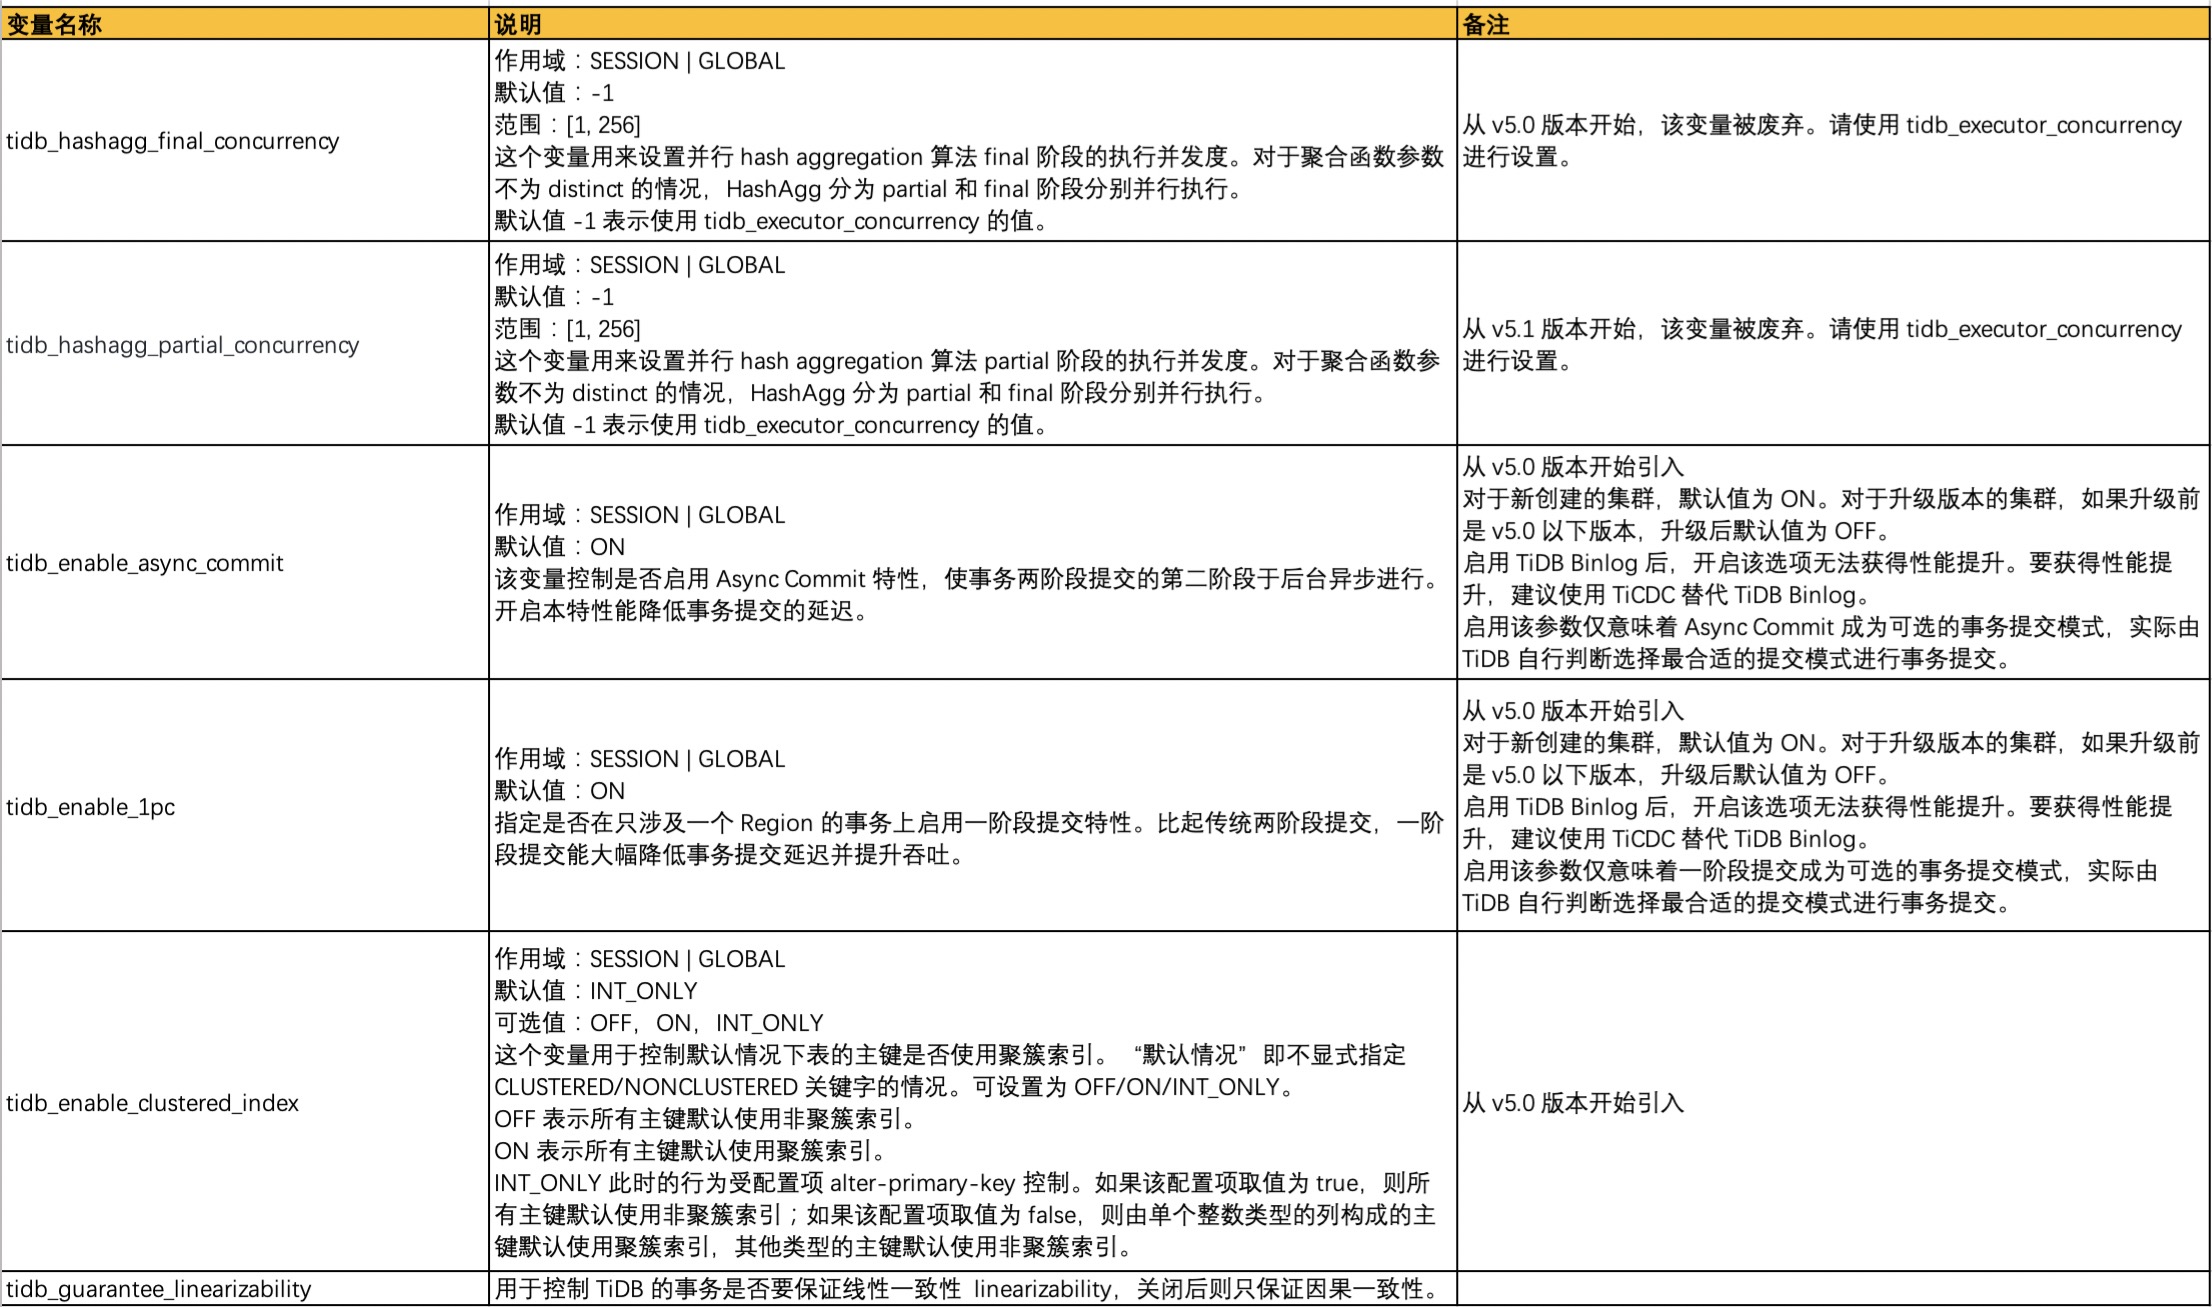
涉及的全局变量说明
HAProxy 配置
详细请参阅 HAProxy 在 TiDB 中的最佳实践。
# cat /etc/haproxy/haproxy.cfg
global                                     # 全局配置。
   log         127.0.0.1 local2            # 定义全局的 syslog 服务器,最多可以定义两个。
   chroot      /var/lib/haproxy            # 更改当前目录并为启动进程设置超级用户权限,从而提高安全性。
   pidfile     /var/run/haproxy.pid        # 将 HAProxy 进程的 PID 写入 pidfile。
   maxconn     4096                        # 单个 HAProxy 进程可接受的最大并发连接数,等价于命令行参数 "-n"。
   #nbthread    48                          # 最大线程数。线程数的上限与 CPU 数量相同。
   user        haproxy                     # 同 UID 参数。
   group       haproxy                     # 同 GID 参数,建议使用专用用户组。
   daemon                                  # 让 HAProxy 以守护进程的方式工作于后台,等同于命令行参数“-D”的功能。当然,也可以在命令行中用“-db”参数将其禁用。
   stats socket /var/lib/haproxy/stats     # 统计信息保存位置。

defaults                                   # 默认配置。
   log global                              # 日志继承全局配置段的设置。
   retries 2                               # 向上游服务器尝试连接的最大次数,超过此值便认为后端服务器不可用。
   timeout connect  2s                     # HAProxy 与后端服务器连接超时时间。如果在同一个局域网内,可设置成较短的时间。
   timeout client 30000s                   # 客户端与 HAProxy 连接后,数据传输完毕,即非活动连接的超时时间。
   timeout server 30000s                   # 服务器端非活动连接的超时时间。

listen admin_stats                         # frontend 和 backend 的组合体,此监控组的名称可按需进行自定义。
   bind 0.0.0.0:8080                       # 监听端口。
   mode http                               # 监控运行的模式,此处为 `http` 模式。
   option httplog                          # 开始启用记录 HTTP 请求的日志功能。
   maxconn 10                              # 最大并发连接数。
   stats refresh 30s                       # 每隔 30 秒自动刷新监控页面。
   stats uri /haproxy                      # 监控页面的 URL。
   stats realm HAProxy                     # 监控页面的提示信息。
   stats auth admin:pingcap123             # 监控页面的用户和密码,可设置多个用户名。
   stats hide-version                      # 隐藏监控页面上的 HAProxy 版本信息。
   stats  admin if TRUE                    # 手工启用或禁用后端服务器(HAProxy 1.4.9 及之后版本开始支持)。

listen tidb-cluster                        # 配置 database 负载均衡。
   bind 0.0.0.0:3390                       # 浮动 IP 和 监听端口。
   mode tcp                                # HAProxy 要使用第 4 层的传输层。
   balance leastconn                       # 连接数最少的服务器优先接收连接。`leastconn` 建议用于长会话服务,例如 LDAP、SQL、TSE 等,而不是短会话协议,如 HTTP。该算法是动态的,对于启动慢的服务器,服务器权重会在运行中作调整。
   server tidb-1 172.0.0.1:4000 check inter 2000 rise 2 fall 3       # 检测 4000 端口,检测频率为每 2000 毫秒一次。如果 2 次检测为成功,则认为服务器可用;如果 3 次检测为失败,则认为服务器不可用。
   server tidb-2 172.0.0.2:4000 check inter 2000 rise 2 fall 3
   server tidb-3 172.0.0.3:4000 check inter 2000 rise 2 fall 3
测试负载均衡
$ mysql -uroot -h172.0.0.4 -P 3390 -e "select @@hostname;"
+---------------------------------------+
| @@hostname                            |
+---------------------------------------+
| 172.0.0.3                             |
+---------------------------------------+

[tidb@tidb-test:/home/tidb]
$ mysql -uroot -h172.0.0.4 -P 3390 -e "select @@hostname;"
+---------------------------------------+
| @@hostname                            |
+---------------------------------------+
| 172.0.0.2                              |
+---------------------------------------+

[tidb@tidb-test:/home/tidb]
$ mysql -uroot -h172.0.0.4 -P 3390 -e "select @@hostname;"
+---------------------------------------+
| @@hostname                            |
+---------------------------------------+
| 172.0.0.1                             |
+---------------------------------------+
测试方案
测试机器是SAS盘,内存和CPU也比较差,曾尝试过造16张1000w的表做测试,跑了一晚上,结果还机器跑挂了,泪流满面 ┭┮﹏┭┮ 。于是重新造 32 张 100w 的表做测试,然后每次测试都各种告警,做了1/3,测试无法持续下去,于是再重造数据,最后用每张 100w 行数据的16张表做的测试对比。
- 通过 TiUP 部署 TiDB v6.0.0 和 v5.4.0。
- 通过 Sysbench 导入 16 张表,每张表有 100 万行数据。
- 备份数据,用于TiDB 不同版本测试前进行数据恢复。
- 启动 Sysbench 客户端,进行 point_select、read_write、update_index 和 update_non_index 测试。通过 HAProxy 向 TiDB 加压,每种负载每个并发数各测试 180 秒。
- 每种类型的测试完成后,分别对每个表执行 analyze table 命令。
- 每轮完成后重新启动集群。
准备测试数据
sysbench oltp_common \
    --threads=16 \
    --rand-type=uniform \
    --db-driver=mysql \
    --mysql-db=sbtest \
    --mysql-host=$tidb_host \
    --mysql-port=4000 \
    --mysql-user=sysbench \
    --mysql-password=password \
    prepare --tables=16 --table-size=1000000
导出测试数据备份
mydumper -h 172.0.0.1 -P 4000 -u sysbench -p 'password' --no-backup-locks -B sbtest -t 2 -F 64 --skip-tz-utc -o /data/tmp/sbtest -L /data/tmp/mydumper_sbtest.log
执行测试
sysbench /usr/share/sysbench/oltp_read_write.lua --mysql-user=sysbench --mysql-password=password \
--mysql-host=$tidb_haproxy_host --mysql-port=3390 --mysql-db=sbtest --tables=16 --table_size=1000000 --threads=$threads --time=180 --report-interval=10 run


sysbench /usr/share/sysbench/oltp_point_select.lua --mysql-user=sysbench --mysql-password=password \
--mysql-host=$tidb_haproxy_host --mysql-port=3390 --mysql-db=sbtest --tables=16 --table_size=1000000 --threads=$threads --time=180 --report-interval=10 run


sysbench /usr/share/sysbench/oltp_update_index.lua --mysql-user=sysbench --mysql-password=password \
--mysql-host=$tidb_haproxy_host --mysql-port=3390 --mysql-db=sbtest --tables=16 --table_size=1000000 --threads=$threads --time=180 --report-interval=10 run


sysbench /usr/share/sysbench/oltp_update_non_index.lua --mysql-user=sysbench --mysql-password=password \
--mysql-host=$tidb_haproxy_host --mysql-port=3390 --mysql-db=sbtest --tables=16 --table_size=1000000 --threads=$threads --time=180 --report-interval=10 run
测试结果
本次测试对比了 TiDB v6.0.0 和 v5.4.0 在 OLTP 场景下的 Sysbench 性能表现。虽然测试机器硬件很差,更大Threads的测试跑不起来,但测试对比结果还是有一定的参考价值。
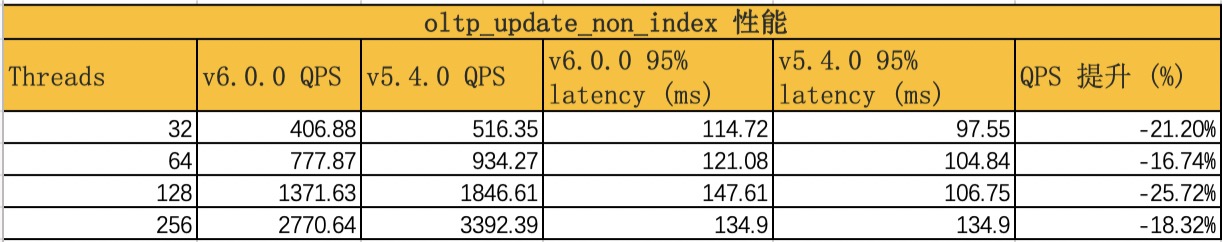
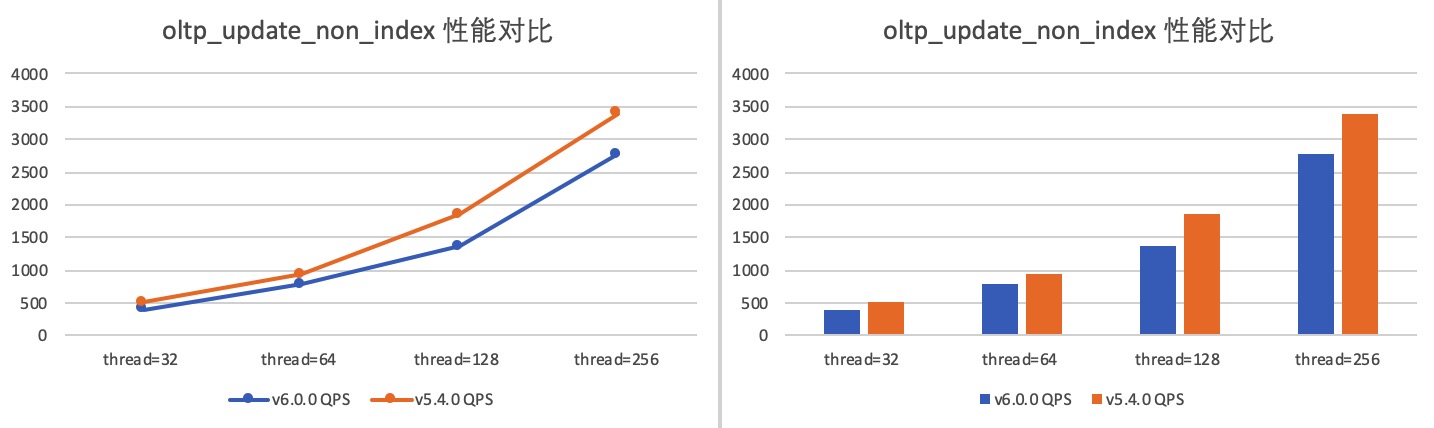
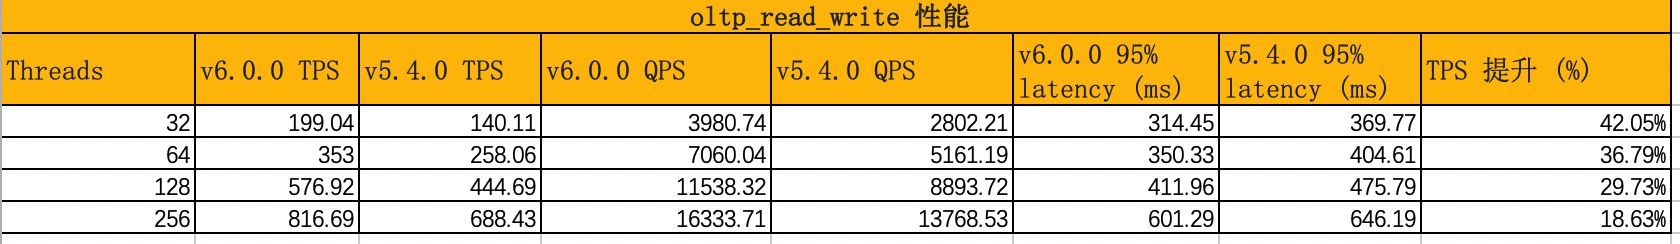
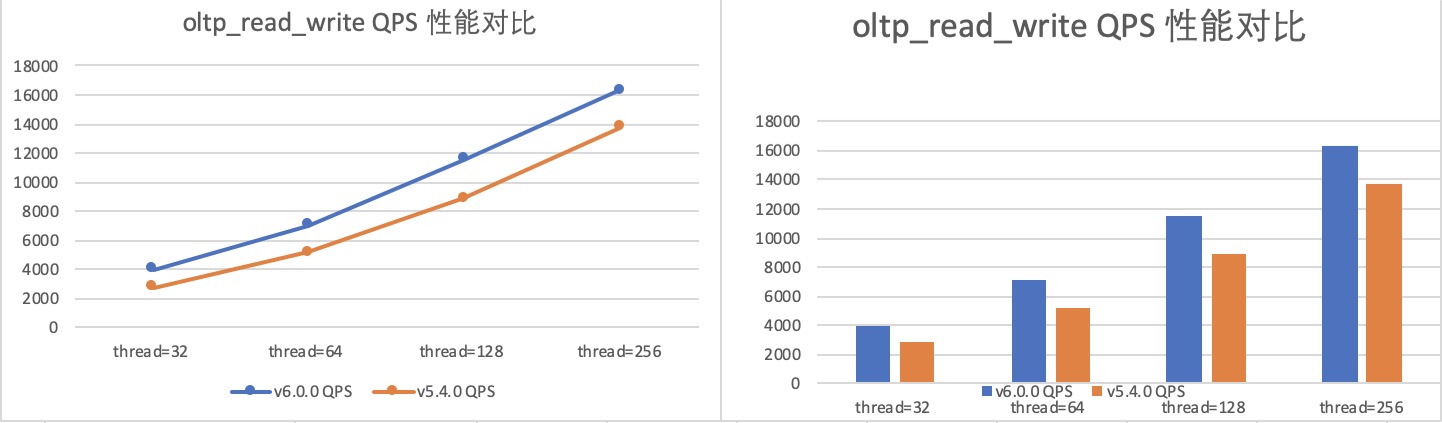
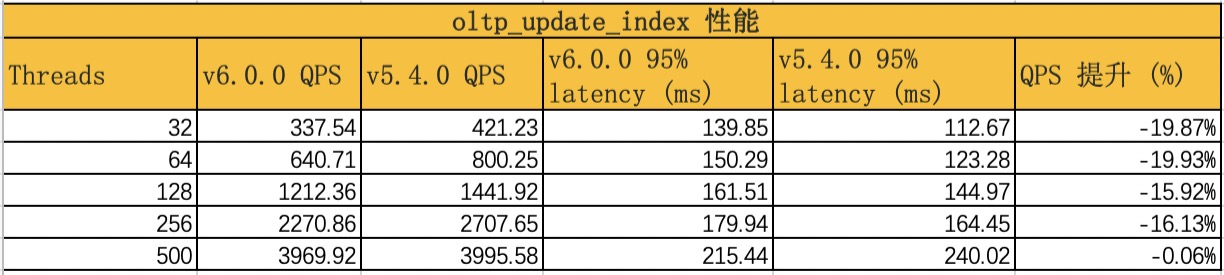
结果显示,相比于 v5.4.0,v6.0.0 的 Read Write 负载性能有大幅提升,提升了 18.63% ,Point Select、Update Index 负载性能遂着Threads越来越高较 v5.4.0 也基本持平, 但 Update Non-index 负载性能则有所下降(这点和官方数据不一致,我也略疑惑,等空了在重测试试)。
Read Write 性能
Point Select 性能


Update Index 性能

Update Non-index 性能