前言
在iOSAPP开发中,我们的代码经常需要调试跟踪,最常用的是LLDB Debugger程序调试器,LLDB Debugger (LLDB) 是一个开源、底层调试器(low level debugger),具有REPL (Read-Eval-Print Loop,交互式解释器)、C++和Python插件,可以在terminal中使用。具有流向控制 (flow control) 和数据检查 (data inspection) 功能。
常用LLDB命令简单操作
P和PO命令
p 命令: print 命令的简写,使用p 命令可以查看基本数据类型的值;如果使用p命令查看的是对象,那么只会返回对象的指针地址。 p命令后面除了可以接变量、常量,还可以接表达式。
po 命令:print object的缩写,可以理解为打印对象。功能与p命令类似,也可以打印常量、变量,打印表达式返回的对象等。p 和 po 的区别在于使用 po 只会输出对应的值,而 p 则会返回值的类型以及命令结果的引用名。


使用p做进制转换
(lldb) p 10
(int) $0 = 10
//转16进制
(lldb) p/x 10
(int) $1 = 0x0000000a
//转8进制
(lldb) p/o 10
(int) $2 = 012
//转二进制
(lldb) p/t 10
(int) $3 = 0b00000000000000000000000000001010
//字符转10进制数字
(lldb) p/d 'A'
(char) $4 = 65
//10进制数字转字符
(lldb) p/c 66
(int) $5 = B\0\0\0
再来看看我们不常用但是很有用的指令
Image 寻址
image 命令主要用于寻址,一般是通过各种组合命令实现不同功能。
image list命令用来查看工程中使用的库

image lookup --address+地址
该命令用于查找可执行文件或共享库的原始地址,当遇到程序崩溃时,可以使用这条命令来根据崩溃日志的原始地址查找崩溃所在的具体位置。

LLDB线程和帧状态检测
在进程停止后,LLDB会选择一个当前线程和线程中当前帧(frame)。很多检测状态的命令可以用于这个线程或帧。
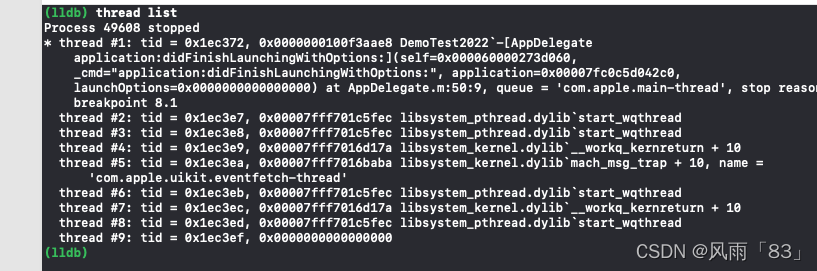
thread list
用于列出所有线程,如下图所示,其中星号(*)表示thread#1为当前线程。
2.thread backtrace堆栈打印,简写bt
bt命令可以打印出线程的堆栈信息,bt命令是打印当前线程的堆栈信息,如下图所示。该信息比左侧的Debug Navigator 看到的还要详细一些。如果嫌堆栈打印太长,可以加一个值限制,如bt 10。

bt all 命令可以打印所有线程的堆栈信息。
LLDB内存读取

x就是memory read内存读取并打印的作用, x是读取内存的命令,x/4gx中第一个x是读取内存命令,后面的g是每次读取8字节,x的意思是16进制显示结果,4表示连续打印4段。
对于g,常用的大小格式为b对应byte 1字节,h对应half word 2字节,w对应word 4字节,g对应giant word 8字节
对于x,我们还可以用o对应8机制,b对应2进制,x对应16进制,f对应浮点,d对应10进制.
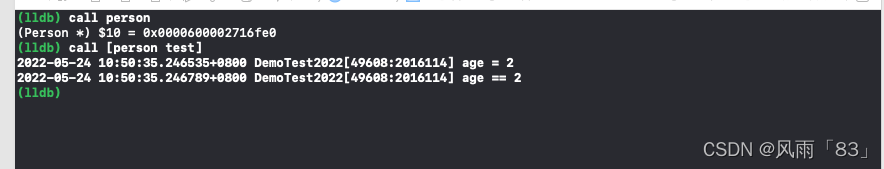
call方法调用
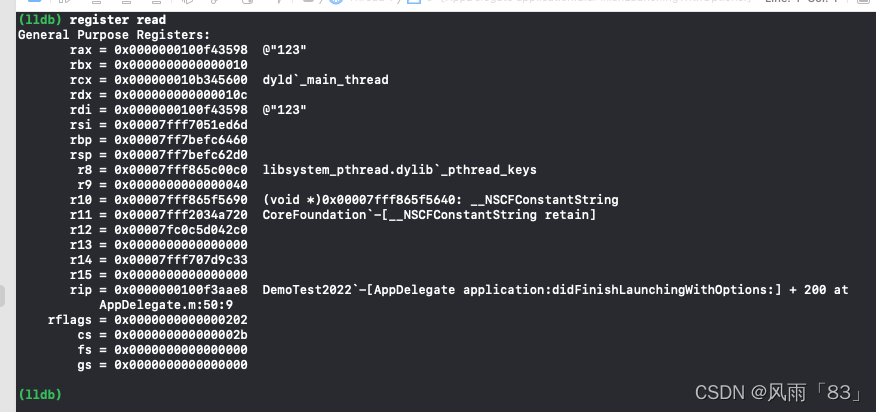
register read
返回当前线程通用寄存器的值(对64为对应x0-x31)
帮助命令help
(lldb) help
Debugger commands:
apropos -- List debugger commands related to a word or subject.
breakpoint -- Commands for operating on breakpoints (see 'help b' for
shorthand.)
command -- Commands for managing custom LLDB commands.
disassemble -- Disassemble specified instructions in the current
target. Defaults to the current function for the
current thread and stack frame.
expression -- Evaluate an expression on the current thread. Displays
any returned value with LLDB's default formatting.
frame -- Commands for selecting and examing the current thread's
stack frames.
gdb-remote -- Connect to a process via remote GDB server. If no host
is specifed, localhost is assumed.
gui -- Switch into the curses based GUI mode.
help -- Show a list of all debugger commands, or give details
about a specific command.
kdp-remote -- Connect to a process via remote KDP server. If no UDP
port is specified, port 41139 is assumed.
language -- Commands specific to a source language.
log -- Commands controlling LLDB internal logging.
memory -- Commands for operating on memory in the current target
process.
platform -- Commands to manage and create platforms.
plugin -- Commands for managing LLDB plugins.
process -- Commands for interacting with processes on the current
platform.
quit -- Quit the LLDB debugger.
register -- Commands to access registers for the current thread and
stack frame.
reproducer -- Commands for manipulating reproducers. Reproducers make
it possible to capture full debug sessions with all its
dependencies. The resulting reproducer is used to replay
the debug session while debugging the debugger.
Because reproducers need the whole the debug session
from beginning to end, you need to launch the debugger
in capture or replay mode, commonly though the command
line driver.
Reproducers are unrelated record-replay debugging, as
you cannot interact with the debugger during replay.
script -- Invoke the script interpreter with provided code and
display any results. Start the interactive interpreter
if no code is supplied.
session -- Commands controlling LLDB session.
settings -- Commands for managing LLDB settings.
source -- Commands for examining source code described by debug
information for the current target process.
statistics -- Print statistics about a debugging session
swift-healthcheck -- Show the LLDB debugger health check diagnostics.
target -- Commands for operating on debugger targets.
thread -- Commands for operating on one or more threads in the
current process.
trace -- Commands for loading and using processor trace
information.
type -- Commands for operating on the type system.
version -- Show the LLDB debugger version.
watchpoint -- Commands for operating on watchpoints.
Current command abbreviations (type 'help command alias' for more info):
add-dsym -- Add a debug symbol file to one of the target's current modules
by specifying a path to a debug symbols file or by using the
options to specify a module.
attach -- Attach to process by ID or name.
b -- Set a breakpoint using one of several shorthand formats.
bt -- Show the current thread's call stack. Any numeric argument
displays at most that many frames. The argument 'all' displays
all threads.
c -- Continue execution of all threads in the current process.
call -- Evaluate an expression on the current thread. Displays any
returned value with LLDB's default formatting.
continue -- Continue execution of all threads in the current process.
detach -- Detach from the current target process.
di -- Disassemble specified instructions in the current target.
Defaults to the current function for the current thread and
stack frame.
dis -- Disassemble specified instructions in the current target.
Defaults to the current function for the current thread and
stack frame.
display -- Evaluate an expression at every stop (see 'help target
stop-hook'.)
down -- Select a newer stack frame. Defaults to moving one frame, a
numeric argument can specify an arbitrary number.
env -- Shorthand for viewing and setting environment variables.
exit -- Quit the LLDB debugger.
f -- Select the current stack frame by index from within the current
thread (see 'thread backtrace'.)
file -- Create a target using the argument as the main executable.
finish -- Finish executing the current stack frame and stop after
returning. Defaults to current thread unless specified.
history -- Dump the history of commands in this session.
Commands in the history list can be run again using "!<INDEX>".
"!-<OFFSET>" will re-run the command that is <OFFSET> commands
from the end of the list (counting the current command).
image -- Commands for accessing information for one or more target
modules.
j -- Set the program counter to a new address.
jump -- Set the program counter to a new address.
kill -- Terminate the current target process.
l -- List relevant source code using one of several shorthand formats.
list -- List relevant source code using one of several shorthand formats.
n -- Source level single step, stepping over calls. Defaults to
current thread unless specified.
next -- Source level single step, stepping over calls. Defaults to
current thread unless specified.
nexti -- Instruction level single step, stepping over calls. Defaults to
current thread unless specified.
ni -- Instruction level single step, stepping over calls. Defaults to
current thread unless specified.
p -- Evaluate an expression on the current thread. Displays any
returned value with LLDB's default formatting.
parray -- parray <COUNT> <EXPRESSION> -- lldb will evaluate EXPRESSION to
get a typed-pointer-to-an-array in memory, and will display
COUNT elements of that type from the array.
po -- Evaluate an expression on the current thread. Displays any
returned value with formatting controlled by the type's author.
poarray -- poarray <COUNT> <EXPRESSION> -- lldb will evaluate EXPRESSION to
get the address of an array of COUNT objects in memory, and will
call po on them.
print -- Evaluate an expression on the current thread. Displays any
returned value with LLDB's default formatting.
q -- Quit the LLDB debugger.
r -- Launch the executable in the debugger.
rbreak -- Sets a breakpoint or set of breakpoints in the executable.
re -- Commands to access registers for the current thread and stack
frame.
repl -- Evaluate an expression on the current thread. Displays any
returned value with LLDB's default formatting.
run -- Launch the executable in the debugger.
s -- Source level single step, stepping into calls. Defaults to
current thread unless specified.
shell -- Run a shell command on the host.
si -- Instruction level single step, stepping into calls. Defaults to
current thread unless specified.
sif -- Step through the current block, stopping if you step directly
into a function whose name matches the TargetFunctionName.
step -- Source level single step, stepping into calls. Defaults to
current thread unless specified.
stepi -- Instruction level single step, stepping into calls. Defaults to
current thread unless specified.
t -- Change the currently selected thread.
tbreak -- Set a one-shot breakpoint using one of several shorthand formats.
undisplay -- Stop displaying expression at every stop (specified by stop-hook
index.)
up -- Select an older stack frame. Defaults to moving one frame, a
numeric argument can specify an arbitrary number.
v -- Show variables for the current stack frame. Defaults to all
arguments and local variables in scope. Names of argument,
local, file static and file global variables can be specified.
Children of aggregate variables can be specified such as
'var->child.x'. The -> and [] operators in 'frame variable' do
not invoke operator overloads if they exist, but directly access
the specified element. If you want to trigger operator
overloads use the expression command to print the variable
instead.
It is worth noting that except for overloaded operators, when
printing local variables 'expr local_var' and 'frame var
local_var' produce the same results. However, 'frame variable'
is more efficient, since it uses debug information and memory
reads directly, rather than parsing and evaluating an
expression, which may even involve JITing and running code in
the target program.
var -- Show variables for the current stack frame. Defaults to all
arguments and local variables in scope. Names of argument,
local, file static and file global variables can be specified.
Children of aggregate variables can be specified such as
'var->child.x'. The -> and [] operators in 'frame variable' do
not invoke operator overloads if they exist, but directly access
the specified element. If you want to trigger operator
overloads use the expression command to print the variable
instead.
It is worth noting that except for overloaded operators, when
printing local variables 'expr local_var' and 'frame var
local_var' produce the same results. However, 'frame variable'
is more efficient, since it uses debug information and memory
reads directly, rather than parsing and evaluating an
expression, which may even involve JITing and running code in
the target program.
vo -- Show variables for the current stack frame. Defaults to all
arguments and local variables in scope. Names of argument,
local, file static and file global variables can be specified.
Children of aggregate variables can be specified such as
'var->child.x'. The -> and [] operators in 'frame variable' do
not invoke operator overloads if they exist, but directly access
the specified element. If you want to trigger operator
overloads use the expression command to print the variable
instead.
It is worth noting that except for overloaded operators, when
printing local variables 'expr local_var' and 'frame var
local_var' produce the same results. However, 'frame variable'
is more efficient, since it uses debug information and memory
reads directly, rather than parsing and evaluating an
expression, which may even involve JITing and running code in
the target program.
x -- Read from the memory of the current target process.
For more information on any command, type 'help <command-name>'.
(lldb)