arthas监控Java程序性能
一、下载arthas
wget https://alibaba.github.io/arthas/arthas-boot.jar
二、监控进程
java -jar arthas-boot.jar --repo-mirror aliyun --use-http
执行命令后选择要监控的进程
java -jar arthas-boot.jar --repo-mirror aliyun --use-http
[INFO] arthas-boot version: 3.6.1
[INFO] Found existing java process, please choose one and input the serial number of the process, eg : 1. Then hit ENTER.
* [1]: 10312 org.apache.kafka.connect.cli.ConnectDistributed
1
[INFO] Start download arthas from remote server: http://arthas.aliyun.com/download/3.6.2?mirror=aliyun
[INFO] Download arthas success.
[INFO] arthas home: /root/.arthas/lib/3.6.2/arthas
[INFO] Try to attach process 10312
[INFO] Attach process 10312 success.
[INFO] arthas-client connect 127.0.0.1 3658
  ,---.  ,------. ,--------.,--.  ,--.  ,---.   ,---.
 /  O  \ |  .--. ''--.  .--'|  '--'  | /  O  \ '   .-'
|  .-.  ||  '--'.'   |  |   |  .--.  ||  .-.  |`.  `-.
|  | |  ||  |\  \    |  |   |  |  |  ||  | |  |.-'    |
`--' `--'`--' '--'   `--'   `--'  `--'`--' `--'`-----'

wiki       https://arthas.aliyun.com/doc
tutorials  https://arthas.aliyun.com/doc/arthas-tutorials.html
version    3.6.2
main_class
pid        10312
time       2022-06-21 15:29:09
三、dashboard
dashboard
Memory            used total max   usage GC
heap              257M 1017M 1820M       gc.ps_scavenge.count 337328
ps_eden_space     27M  326M  668M  4.06% gc.ps_scavenge.time( 2131508
ps_survivor_space 1M   7M    7M          ms)
ps_old_gen        228M 683M  1365M                            631
nonheap           97M  99M   -1          gc.ps_marksweep.time 44030
code_cache        39M  40M   240M        (ms)
metaspace         51M  53M   -1
compressed_class_ 5M   6M    1024M 0.55%
space

Runtime
os.name                                  Linux
os.version                               3.10.0-1160.11.1.el7.x86_64
java.version                             1.8.0_181
java.home                                /usr/java/jdk1.8.0_181-amd64/jre
systemload.average                       0.17
processors                               16
timestamp/uptime                         Tue Jun 21 16:32:49 CST 2022/2869716s
ID NAME                 GROUP     PRIORI STATE  %CPU   DELTA_ TIME  INTERR DAEMON
39 PollableSourceRunner main      5      RUNNAB 5.28   0.263  1637: false  false
36 SinkRunner-PollingRu main      5      TIMED_ 0.72   0.036  332:4 false  false
10 Timer-for-arthas-das system    5      RUNNAB 0.61   0.030  0:18. false  true
42 kafka-coordinator-he main      5      TIMED_ 0.03   0.001  11:7. false  true
16 hdfs-sink1-call-runn main      5      WAITIN 0.02   0.000  1:0.4 false  false
46 hdfs-sink1-call-runn main      5      WAITIN 0.02   0.000  0:59. false  false
-1 VM Periodic Task Thr -         -1     -      0.02   0.000  8:30. false  true
56 hdfs-sink1-call-runn main      5      WAITIN 0.02   0.000  0:59. false  false
52 hdfs-sink1-call-runn main      5      WAITIN 0.02   0.000  0:59. false  false
13 hdfs-sink1-call-runn main      5      WAITIN 0.02   0.000  0:59. false  false
47 hdfs-sink1-call-runn main      5      WAITIN 0.02   0.000  1:0.4 false  false
35 hdfs-sink1-call-runn main      5      WAITIN 0.01   0.000  1:0.5 false  false
33 hdfs-sink1-call-runn main      5      WAITIN 0.01   0.000  0:59. false  false
34 hdfs-sink1-call-runn main      5      WAITIN 0.01   0.000  1:0.1 false  false
48 hdfs-sink1-call-runn main      5      WAITIN 0.01   0.000  1:0.4 false  false
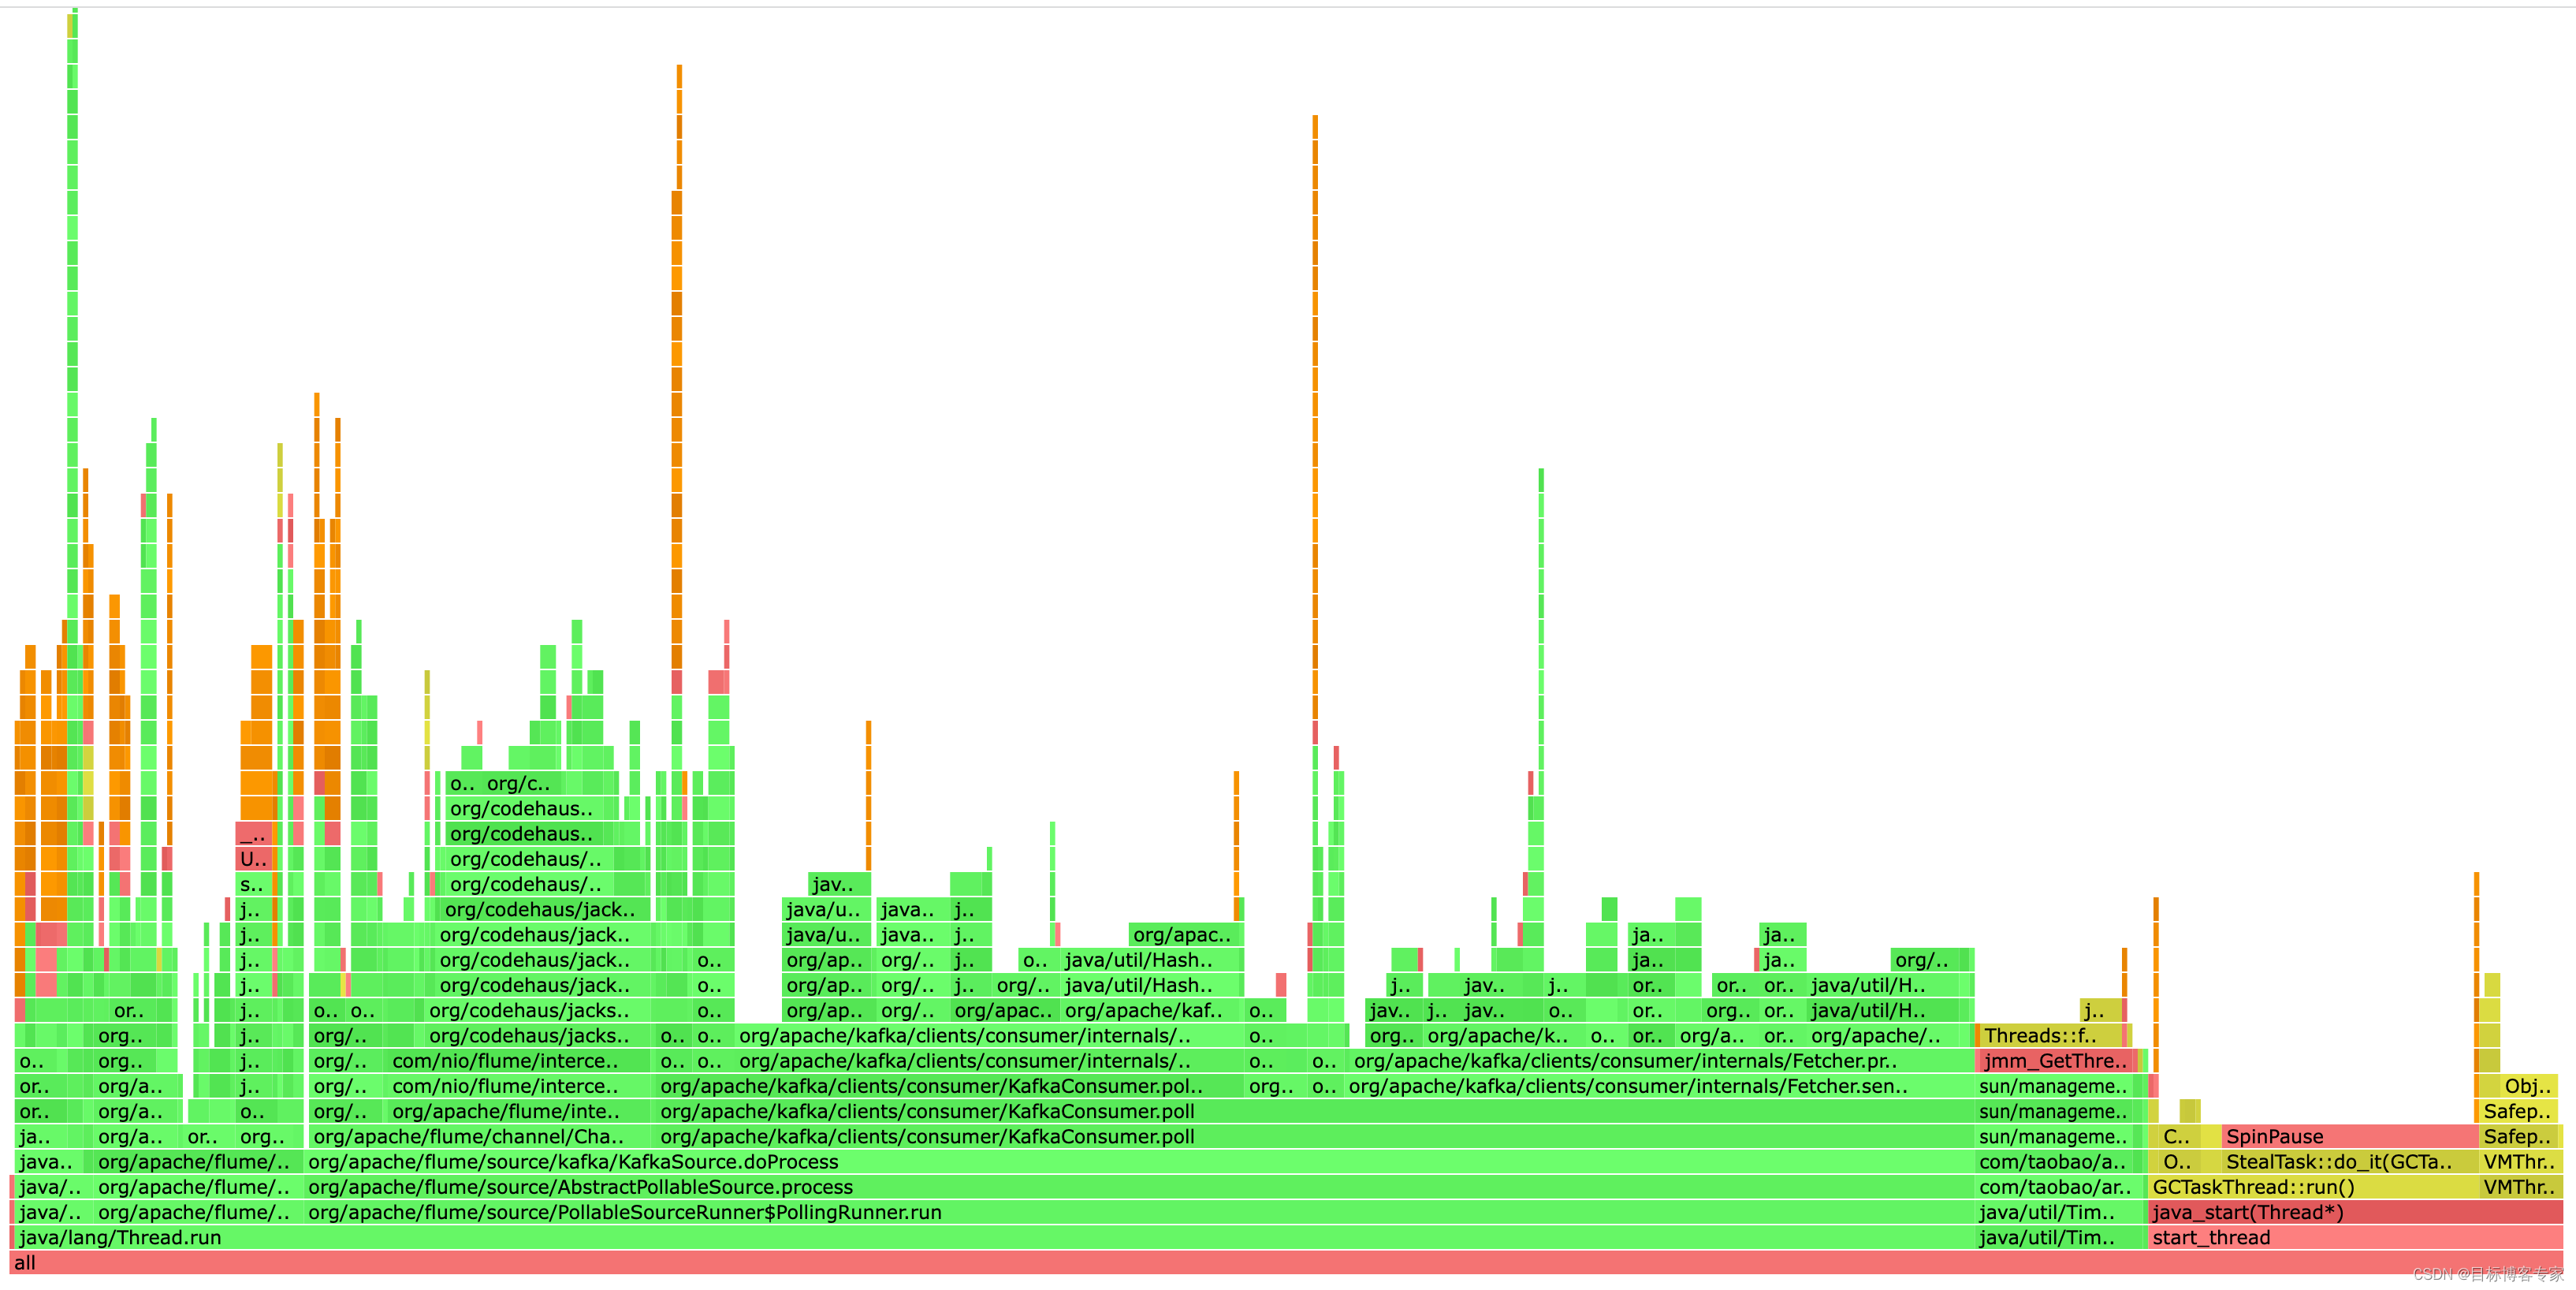
四、火焰图
[arthas@25575]$ profiler start
Profiling started
[arthas@25575]$ profiler getSamples
291
[arthas@25575]$ profiler status
Profiling is running for 39 seconds
[arthas@25575]$ profiler stop
OK
profiler output file: /data/src/flume/teflume-prod/apache-flume-1.9.0-bin/arthas-output/20220621-161810.html