前言
在这篇文章中搭建了crash的调试环境,简单的描述了crash的使用:centos7 kdump、crash调试内核,接下来详细描述crash的功能,主要是调试系统正在运行的内核虚拟地址空间。
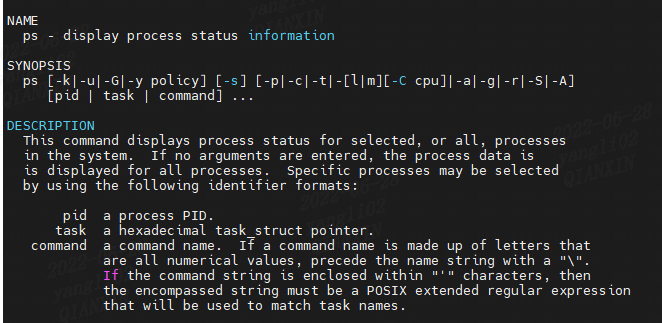
crash [OPTION]... [NAMELIST] (live system form)
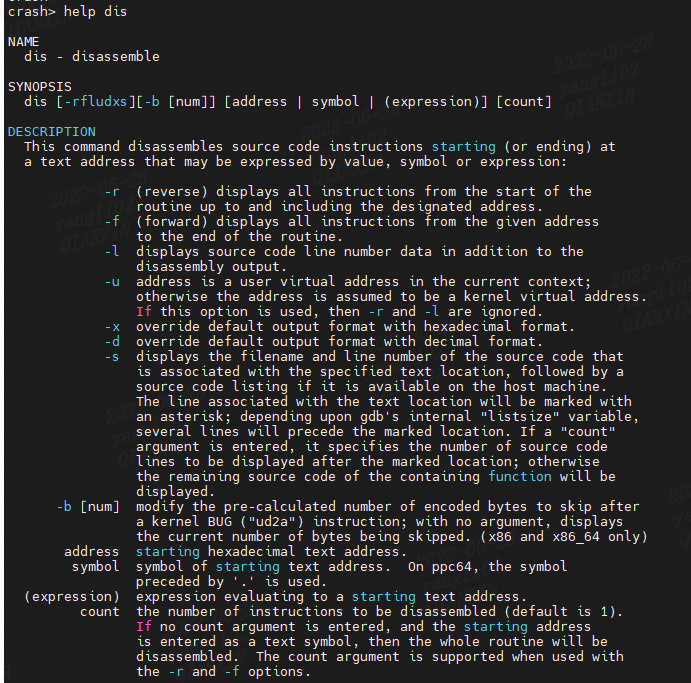
1.dis
disassembles memory, either entire kernel functions, from a location for a specified number of instructions, or from the start of a function up to a specified memory location.
反汇编整个内核函数,内存地址、从指定数量的指令的位置,或从函数的开始到指定的内存位置
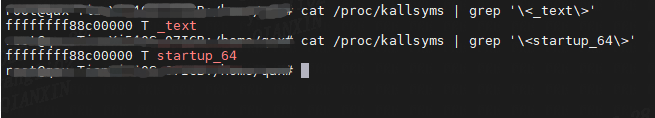
cat /proc/kallsyms | grep '\<_text\>'
cat /proc/kallsyms | grep '\<startup_64\>'
_text是内核代码段的起始地址,也就是 startup_64 函数
(1)
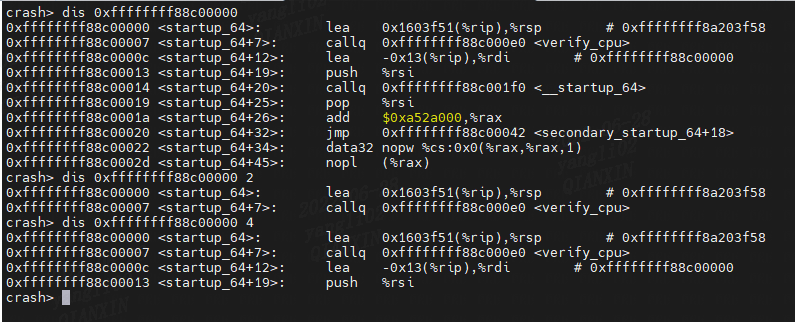
反汇编整个函数:
dis startup_64

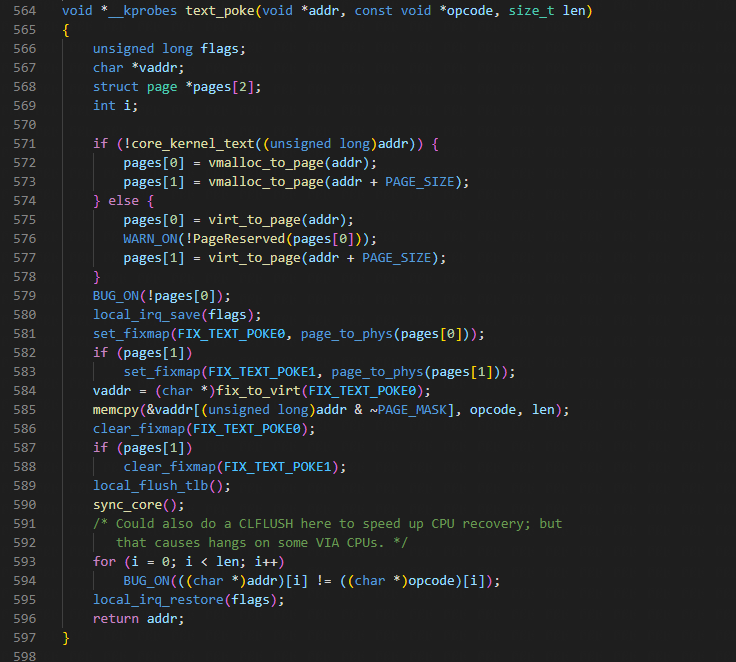
查看函数text_poke源码,所在文件,以及行数:
dis -s text_poke
 -s  displays the filename and line number of the source code that
     is associated with the specified text location, followed by a
     source code listing if it is available on the host machine.
     The line associated with the text location will be marked with
     an asterisk; depending upon gdb's internal "listsize" variable,
     several lines will precede the marked location. If a "count"
     argument is entered, it specifies the number of source code
     lines to be displayed after the marked location; otherwise
     the remaining source code of the containing function will be
     displayed.
显示了函数text_poke在内核源码中哪个文件,行数,以及函数源码:
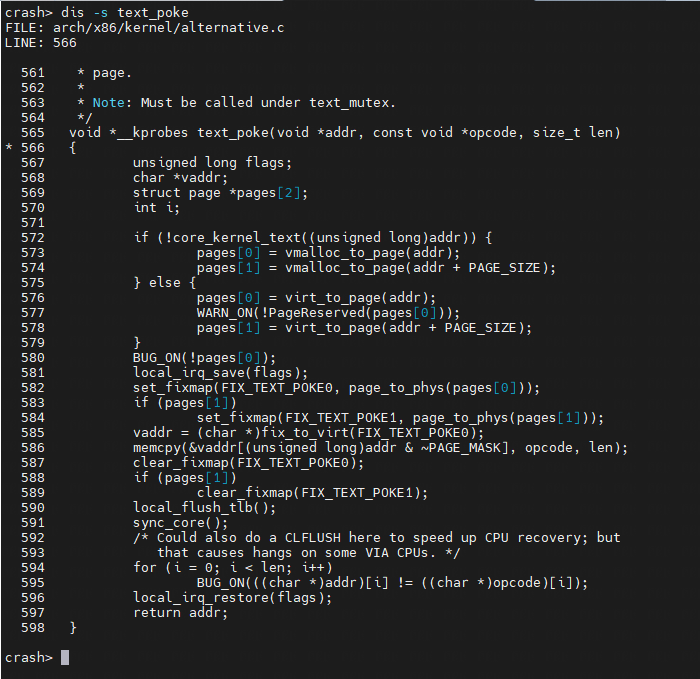
我与源码进行对比,内核版本3.10.0:
//arch/x86/kernel/alternative.c
(2)
分别从startup_64函数开始反汇编 一条指令,两条指令,三条指令
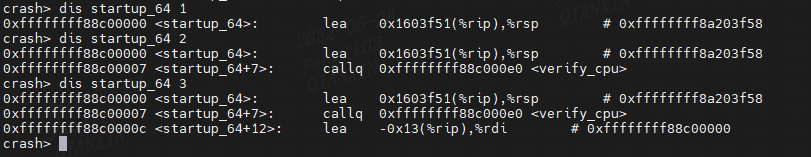
(3)
从startup_64函数指定的偏移位置开始反汇编
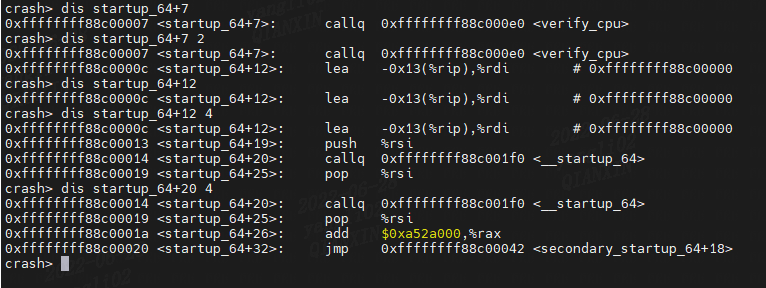
(4)
从指定内存地址开始反汇编
2.rd
displays the contents of memory, with the output formatted in several different manners.
Enter "help rd" for details.
显示内存的内容,并以几种不同的方式格式化输出。
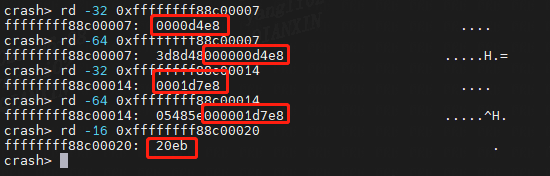
(1)
我用castone反汇编出来的三条跳转指令为例,包括其地址,操作码,操作数,和机器码。

分别从对应的内存地址读取32位,64位,16位内容进行对比机器码,经过对比机器码一样。
 -8  display output in 8-bit values.
 -16  display output in 16-bit values.
 -32  display output in 32-bit values (default on 32-bit machines).
 -64  display output in 64-bit values (default on 64-bit machines).
(2)
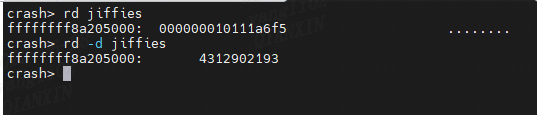
rd读取jiffies全局变量,显示其地址和值:
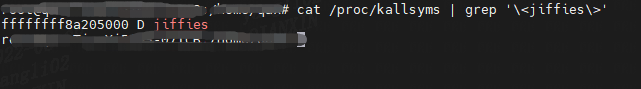
Read jiffies in hexadecimal and decimal format:
(3)
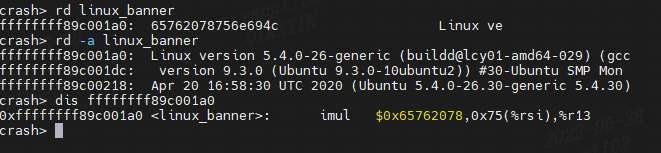
Read Linux version

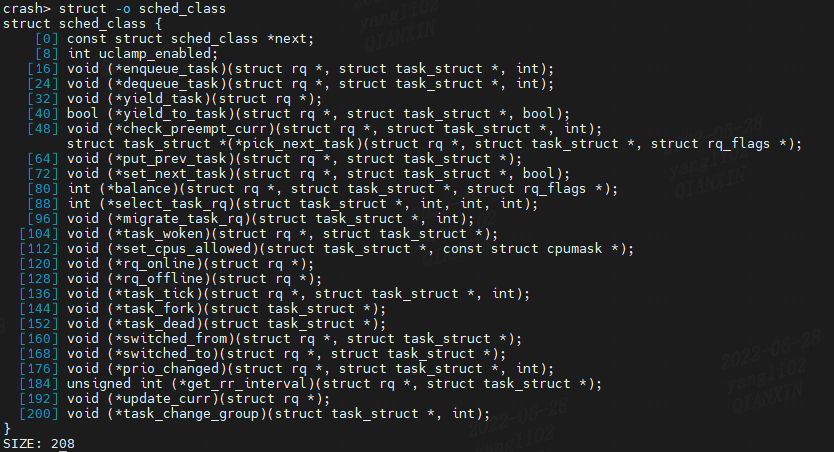
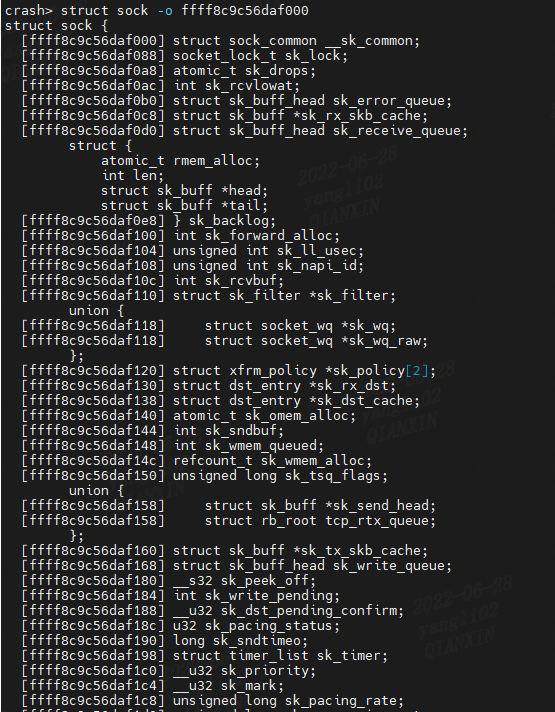
3.struct
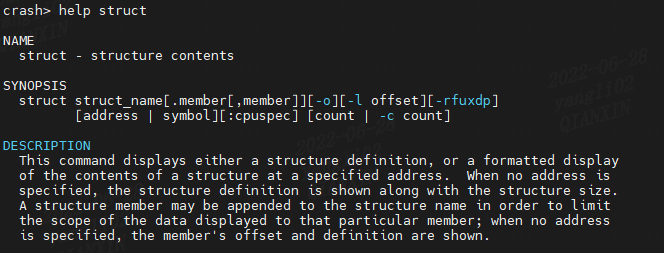
查看结构体成员:
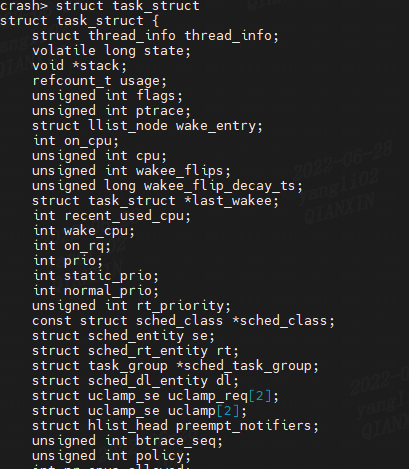
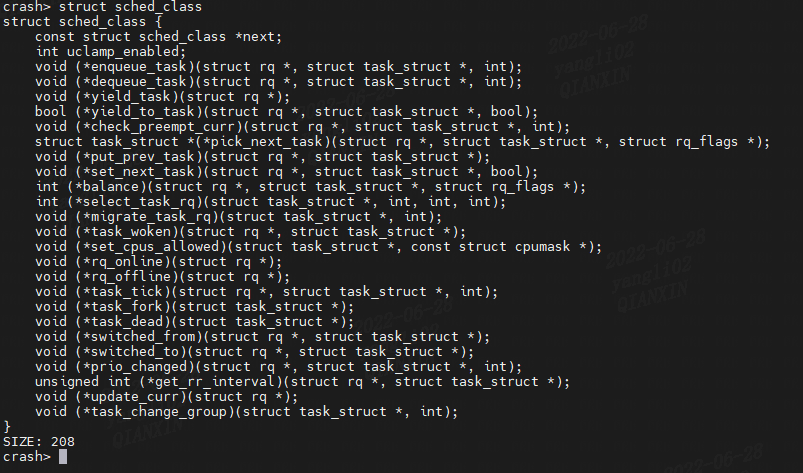
查看结构体成员以及其各个成员的相对偏移位置:
 -o  show member offsets when displaying structure definitions;
 if used with an address or symbol argument, each member will be preceded by its virtual address.
(2)
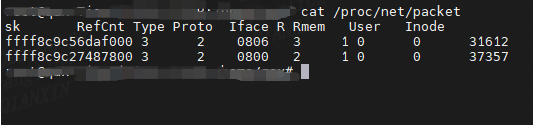
查看packet套接字:
把指定地址的内容以 struct sock结构体解析打印:
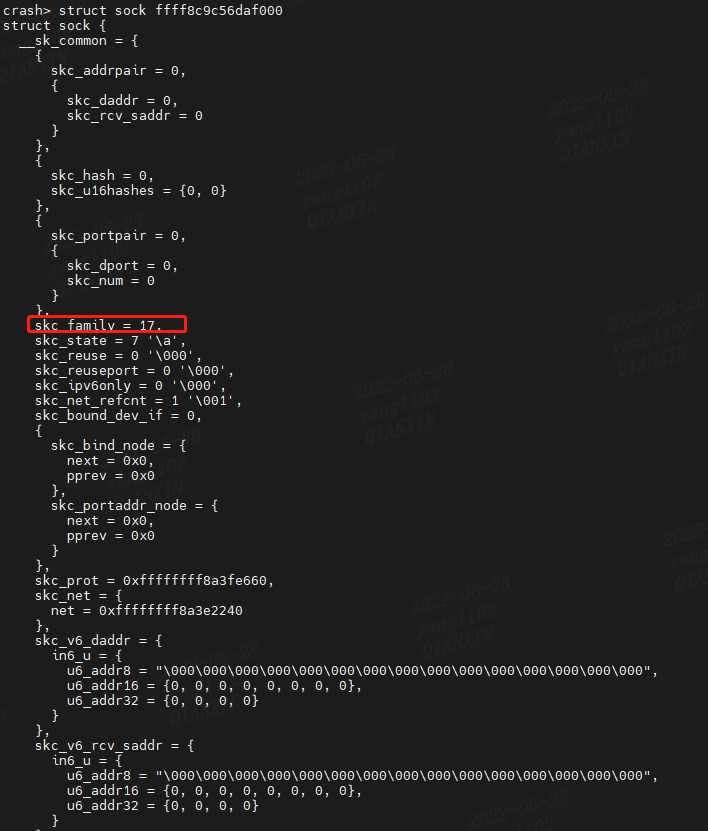
include/linux/socket.h
#define AF_PACKET	17	/* Packet family		*/
#define PF_PACKET	AF_PACKET
查看结构体成员以及其各个成员的绝对虚拟地址位置:
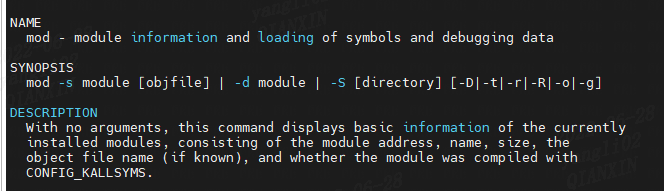
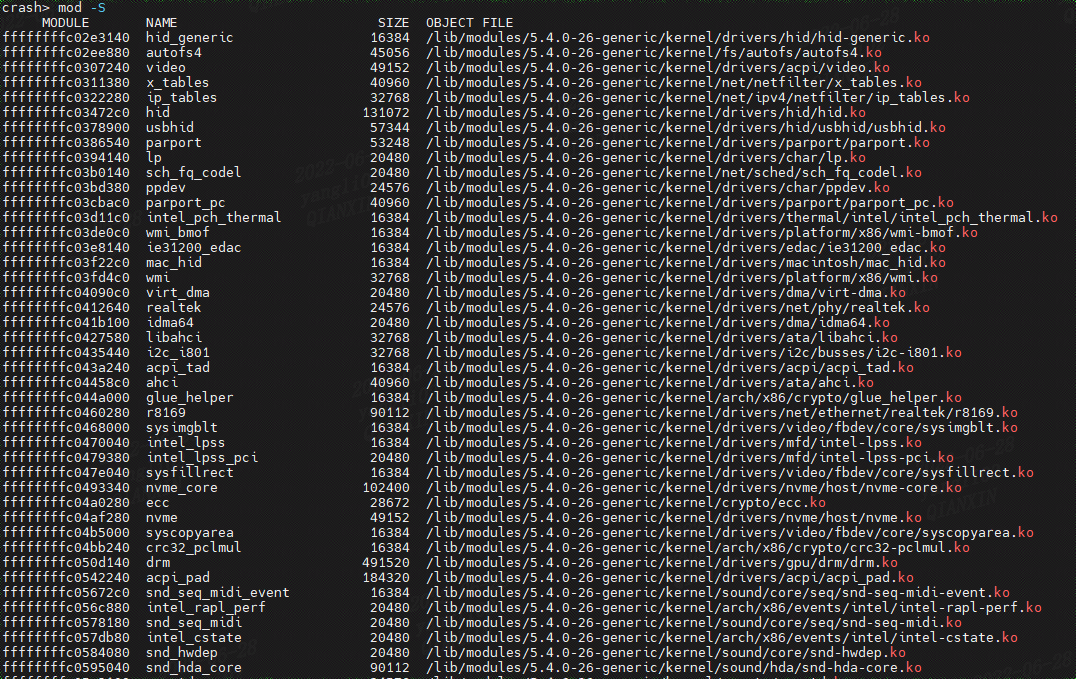
4.mod
查看已经加载的模块信息:
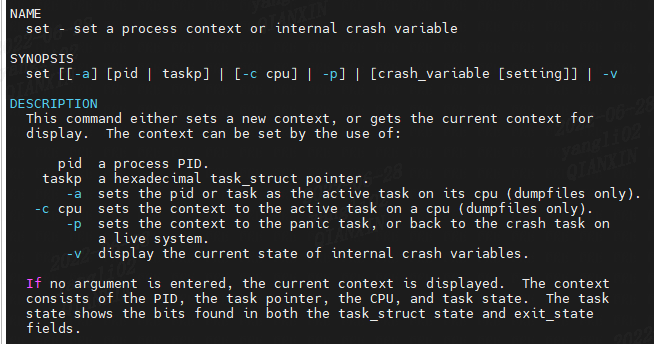
5.set
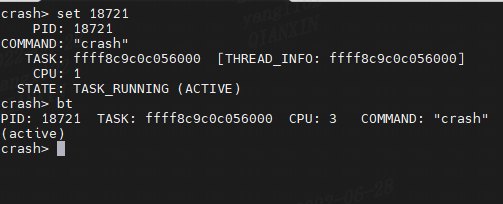
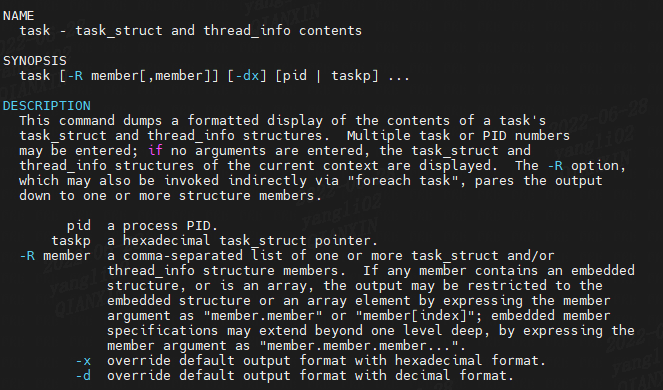
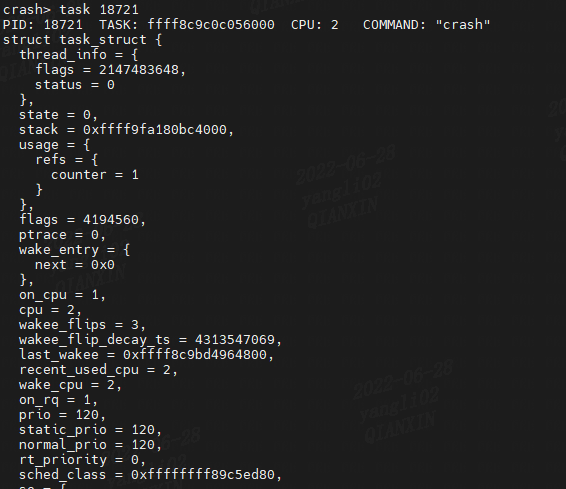
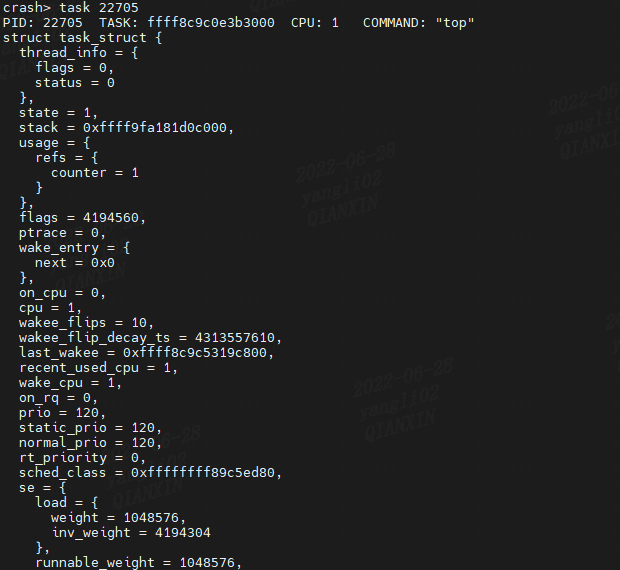
6.task
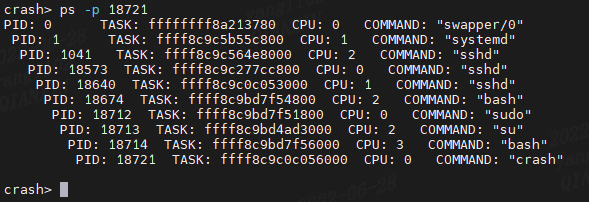
查看指定任务的task_struct和thread_thread信息
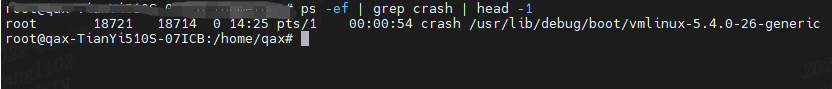
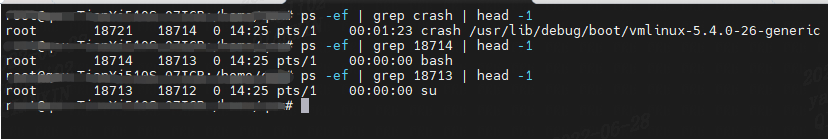
7.ps
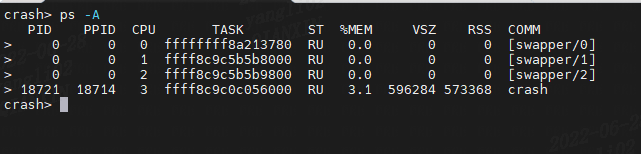
查看活跃的进程:
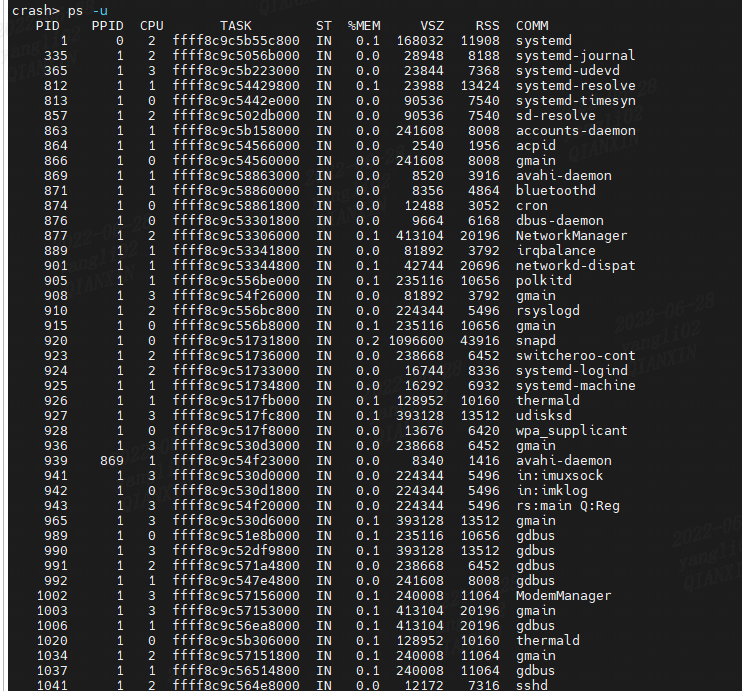
查看用户态进程:
-u restrict the output to only user tasks.
查看内核态进程:
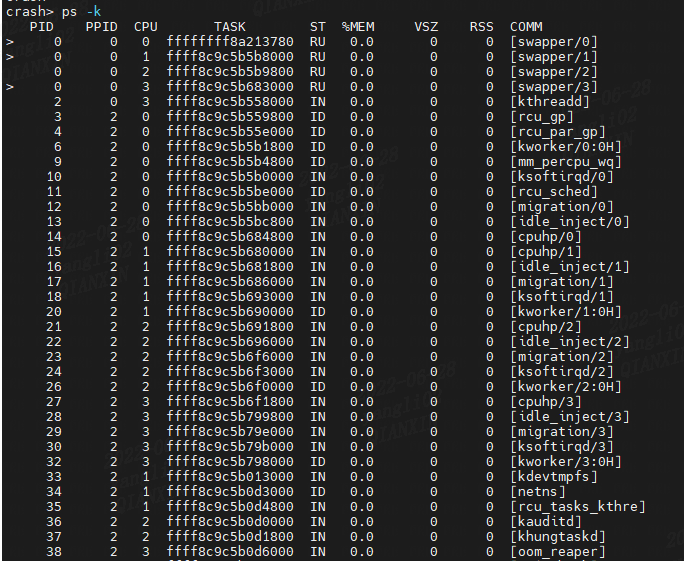
-k restrict the output to only kernel threads.
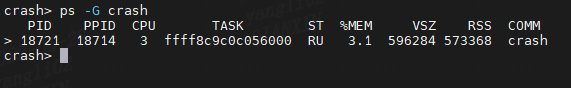
查看线程组中的线程组领导者:
 -G  display only the thread group leader in a thread group.
 Display only the thread group leader in the crash session:
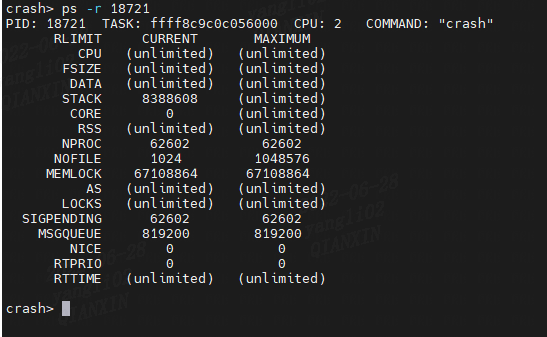
查看进程的资源限制:
-r display resource limits (rlimits) of selected, or all, tasks.
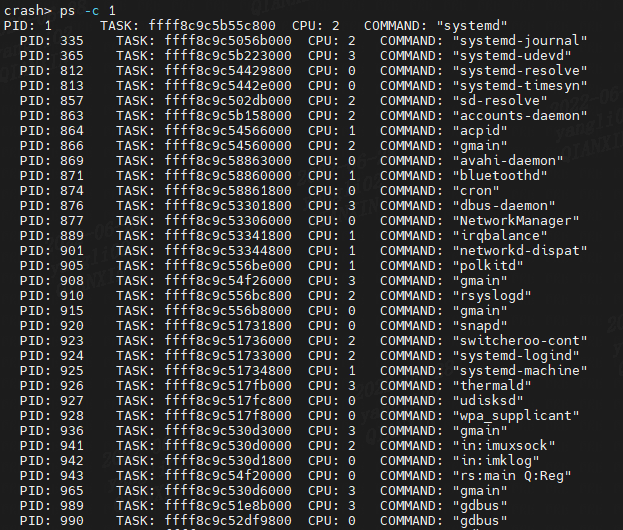
查看进程的子进程:
-c display the children of selected, or all, tasks.
查看进程的父进程:
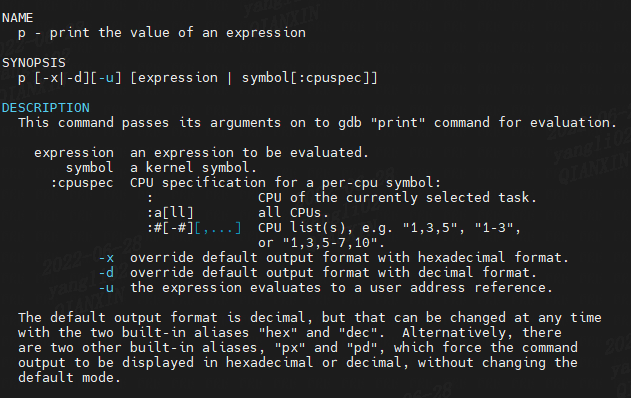
8.p
查看全局变量的值:
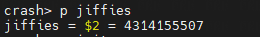
(1)
Print the contents of jiffies
(2)
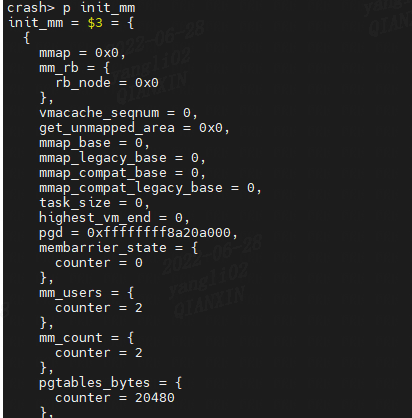
Print the contents of the vm_area_struct "init_mm"
(3)
If a per-cpu symbol is entered as a argument, its data type and all of its per-cpu addresses are displayed:
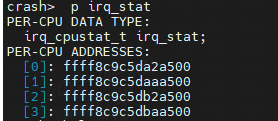
To display the contents a per-cpu symbol for CPU 1, appenda cpu-specifier:

(4)打印TCP缓冲区参数
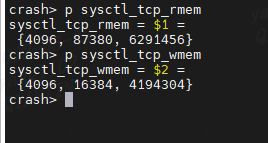
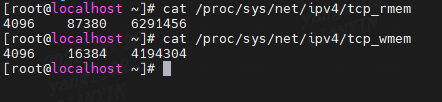
可以看到通过crash和/proc/sys/看到的全局变量值是一样的。
总结
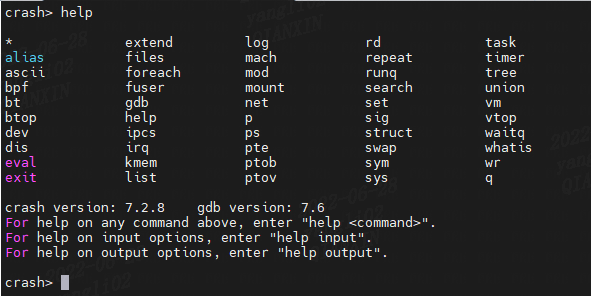
通过help查看crash支持的命令:
对于每个命令的使用和说明可以用help查看:
参考资料
https://www.jianshu.com/p/ad03152a0a53
https://blog.csdn.net/KingOfMyHeart/article/details/98240185