Matplotlib 作业
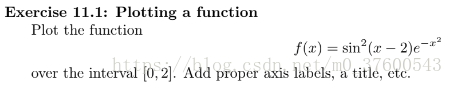
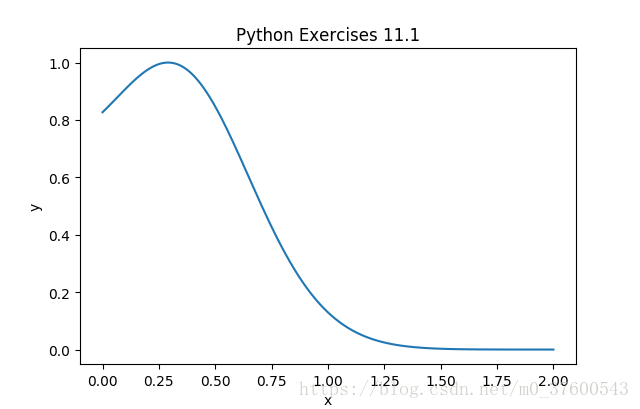
11.1 题目
(1)代码:
import numpy as np
import matplotlib.pyplot as plt
x = np.linspace(0, 2, 1000)
y = [np.power(np.sin((i - 2) * np.exp(-np.power(i, 2))), 2) for i in x]
plt.figure("Python Exercises 11.1")
plt.title("Python Exercises 11.1")
plt.xlabel('x')
plt.ylabel('y')
plt.plot(x, y)
plt.show()
(2)结果截图:
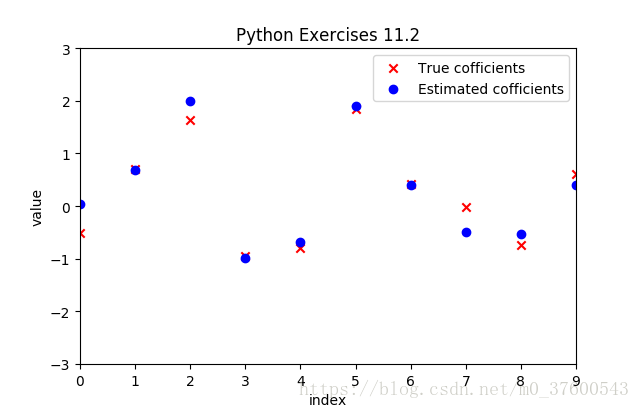
11.2 题目
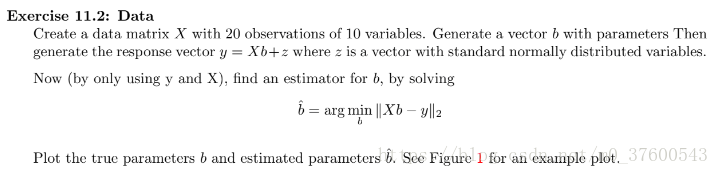
(1)代码:
import numpy as np
import matplotlib.pyplot as plt
X = np.asmatrix(np.random.normal(size=(20, 10)))
b = np.random.normal(size=(10, 1))
z = np.asmatrix(np.random.normal(size=(20, 1)))
y = X.dot(b) + z
# solve "X * b - y = 0"
est_b = np.asarray(np.linalg.lstsq(X, y, rcond=None)[0])

plt.figure("Python Exercises 11.2")
plt.title("Python Exercises 11.2")
x = np.linspace(0, 9, 10)
p1 = plt.scatter(x, b, marker = 'x', c = 'r')
p2 = plt.scatter(x, est_b, marker = 'o', c = 'b')
plt.legend([p1, p2],['True cofficients','Estimated cofficients'])
plt.axis([0, 9, -3, 3])
plt.xlabel('index')
plt.ylabel('value')
plt.show()
(2)结果截图:
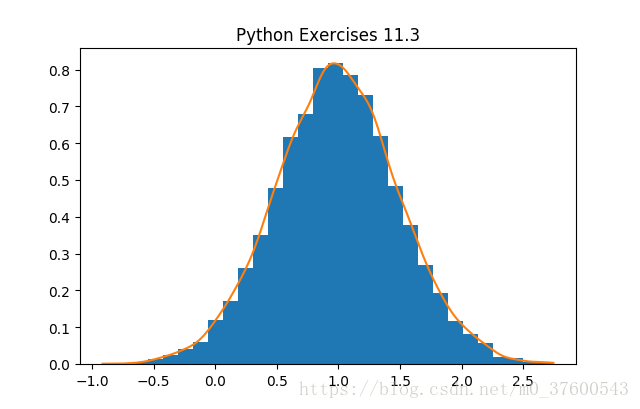
11.3 题目

(1)代码:
import numpy as np
import matplotlib.pyplot as plt
import scipy.stats

z = np.random.normal(1, 0.5, size=(10000))
z = sorted(z)
plt.figure("Python Exercises 11.3")
plt.title("Python Exercises 11.3")
plt.hist(z, bins=30, density=True)
k = scipy.stats.gaussian_kde(z)
plt.plot(z, k.pdf(z))
plt.show()