前言
通常当柱状图数据过多时一般会添加一个滑块,如下图:
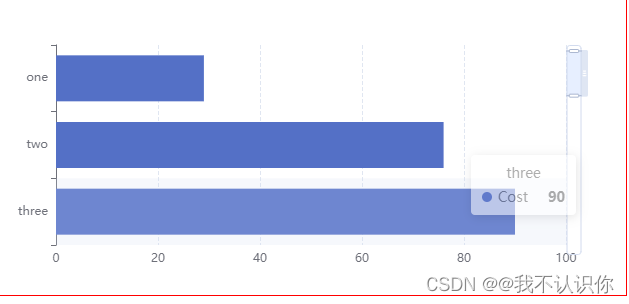
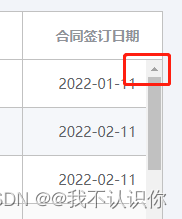
最近客户提出了一个要求,一开始显示的是前3条数据,想看第4条数据的话可以用滑块进行拖动。可能是客户鼠标比较灵敏吧,不好操作。客户想要一个类似滚动条箭头可以点击的功能,如:
思考了很久,最终觉得可以通过toolbox 工具栏来实现。
官方API:https://echarts.apache.org/zh/option.html#toolbox
实现页面布局
这里主要是接着自定义工具栏来实现,常用属性基本上就是下面这些,其他属性可以查看官方文档。
icon:图标,我这里使用的是svg格式,path:// 是固定的,后面的是svg的path属性值,就是路径
toolbox: {


     show: true, // 是否显示
     orient: 'horizontal', // 方向
     itemSize: 15, // 图标大小
     itemGap: 8, // 间隔
     showTitle: true, // 鼠标悬浮时是否显示标题
     feature: {

     // 工具配置
         myLeft: {


             show: true,
             title: '上一个',
             icon: 'path://M735.208665 65.582671l-446.41733 446.417329 446.41733 446.417329z',
             onclick: () => {


                 alert('上一个');
             }
         },
         myRight: {


             show: true,
             title: '下一个',
             icon: 'path://M288.791335 65.582671l446.41733 446.417329-446.41733 446.417329z',
             onclick: () => {


                 alert('下一个');
             }
         }
     },
     iconStyle: {

     // 图标样式
         color: '#869AD7'
     },
     right: 3
 },
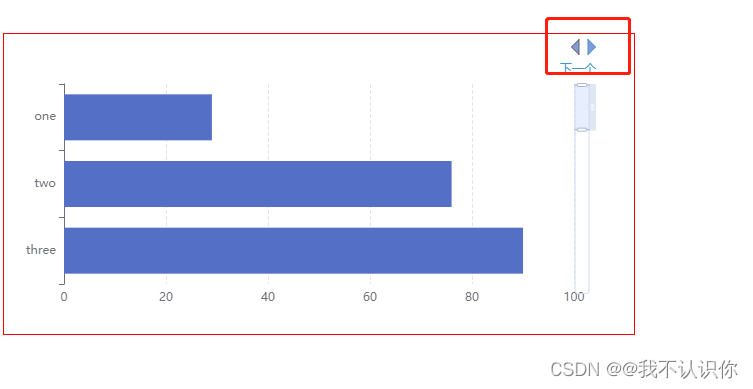
效果图
关于位置、图标样式可以自己定义。
功能
从上面可以看到,每一个图标都有一个点击事件。然后我们可以借助官方提供的action 来实现
myChart.dispatchAction({


    type: 'dataZoom',
    // 可选,dataZoom 组件的 index,多个 dataZoom 组件时有用,默认为 0
    dataZoomIndex: 0,
    // 开始位置的数值
    startValue: 6,
    // 结束位置的数值
    endValue: 7
});

完整代码
<template>
    <div id="demo"></div>
</template>

<script setup lang="ts">
import * as echart from 'echarts';
import {

     onMounted, ref } from 'vue';

const start = ref(7);
const end = ref(9);

onMounted(() => {


    const myChart = echart.init(document.getElementById('demo'));
    const option = {


        tooltip: {


            trigger: 'axis',
            axisPointer: {


                type: 'shadow'
            }
        },
        grid: {


            top: 50,
            bottom: 50,
            right: 30
        },
        toolbox: {


            show: true, // 是否显示
            orient: 'horizontal', // 方向
            itemSize: 15, // 图标大小
            itemGap: 8, // 间隔
            showTitle: true, // 鼠标悬浮时是否显示标题
            feature: {

     // 工具配置
                myLeft: {


                    show: true,
                    title: '上一个',
                    icon: 'path://M735.208665 65.582671l-446.41733 446.417329 446.41733 446.417329z',
                    onclick: () => {


                        if (end.value < 9) {


                            start.value += 1;
                            end.value += 1;
                        }
                        myChart.dispatchAction({


                            type: 'dataZoom',
                            // 可选,dataZoom 组件的 index,多个 dataZoom 组件时有用,默认为 0
                            dataZoomIndex: 0,
                            // 开始位置的数值
                            startValue: start.value,
                            // 结束位置的数值
                            endValue: end.value
                        });
                    }
                },
                myRight: {


                    show: true,
                    title: '下一个',
                    icon: 'path://M288.791335 65.582671l446.41733 446.417329-446.41733 446.417329z',
                    onclick: () => {


                        if (start.value > 0) {


                            start.value -= 1;
                            end.value -= 1;
                        }
                        myChart.dispatchAction({


                            type: 'dataZoom',
                            // 可选,dataZoom 组件的 index,多个 dataZoom 组件时有用,默认为 0
                            dataZoomIndex: 0,
                            // 开始位置的数值
                            startValue: start.value,
                            // 结束位置的数值
                            endValue: end.value
                        });
                    }
                }
            },
            iconStyle: {

     // 图标样式
                color: '#869AD7'
            },
            right: 3
        },
        xAxis: {


            type: 'value',
            splitLine: {


                lineStyle: {


                    type: 'dashed'
                }
            }
        },
        yAxis: {


            type: 'category',
            data: [
                'ten',
                'nine',
                'eight',
                'seven',
                'six',
                'five',
                'four',
                'three',
                'two',
                'one'
            ]
        },
        // 设置滑块
        dataZoom: [
            {


                // 是否显示滑块
                show: true,
                // 那一条y轴的滑块
                yAxisIndex: 0,
                // 当前数据窗口外的数据,被 设置为空
                filterMode: 'empty',
                // 滑块的宽高
                width: 15,
                height: '70%',
                // 滚动条內空白显示
                showDataShadow: false,
                // 滑块的位置
                left: '95%',
                // 起始位置 类目轴表示下标
                startValue: 10,
                // 结束位置
                endValue: 8,
                // 锁定选择区域的大小  最多显示3个类目
                zoomLock: true
            }
        ],
        series: [
            {


                name: 'Cost',
                type: 'bar',
                data: [12, 23, 34, 56, 43, 67, 89, 90, 76, 29]
            }
        ]
    };
    myChart.setOption(option);
});
</script>

<style lang="scss" scoped>
#demo{


    width: 600px;
    height: 300px;
    border: 1px solid red;
    padding-right: 30px;
}
</style>
效果图

注意点:
关于起始值、结束值的初始值是几与你滑块的方向有关是水平还是垂直。另外还与滑块的位置有关,滑块一开始是上面还是下面。
bug
之前忽略了一个问题,就是当滑块滑动后要更新开始值和结束值。可以通过给滑块添加监听事件
myChart.on('datazoom', params => {


     this.$nextTick(() => {


         // 更新起始值和结束值
         console.log(params,this.start,this.end);
         console.log(myChart.getOption());
         this.start = (myChart.getOption()).dataZoom[0].startValue;
         this.end = (myChart.getOption()).dataZoom[0].endValue;
     });
 });
不要直接使用滑块回调的参数,有问题,很难进行处理。使用getOption()来获取,这是最方便的