echarts画图
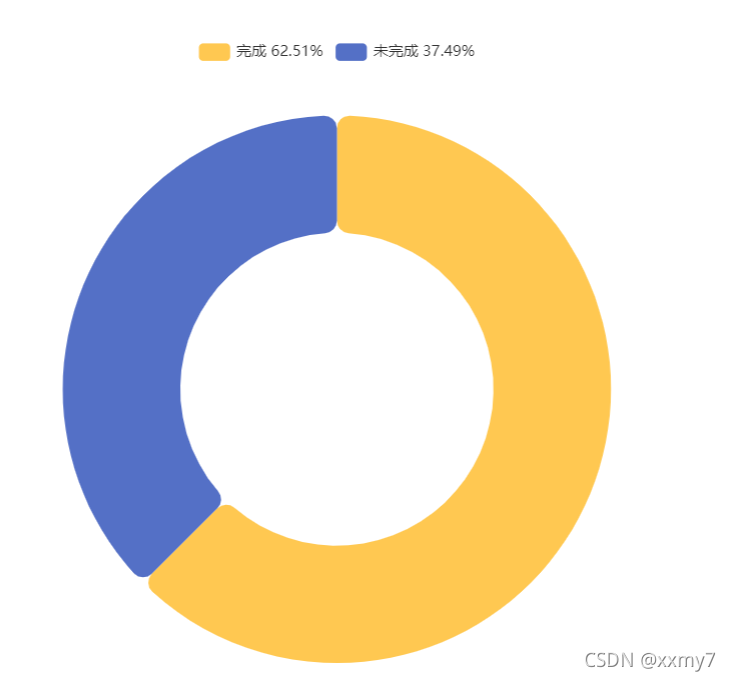
一、饼状图
示例编辑
option = {


    tooltip: {


        trigger: 'item'
    },
    legend: {


        top: '5%',
        left: 'center'
    },
    series: [
        {


            name: '访问来源',
            type: 'pie',
            radius: ['40%', '70%'],
            avoidLabelOverlap: false,
            label: {


                show: false,
                position: 'center'
            },
            emphasis: {


                label: {


                    show: true,
                    fontSize: '40',
                    fontWeight: 'bold'
                }
            },
            labelLine: {


                show: false
            },
            data: [
                {

    value: 522, name: '完成 62.51%',itemStyle: {


                    color:'#FFC851',
                    show: true,
                }},
                {

    value: 313, name: '未完成 37.49%' }
            ]
        }
    ]
};
完整代码:
import * as echarts from 'echarts';

var chartDom = document.getElementById('main');
var myChart = echarts.init(chartDom);
var option;

option = {


    tooltip: {


        trigger: 'item'
    },
    legend: {


        top: '5%',
        left: 'center'
    },
    series: [
        {


            name: '访问来源',
            type: 'pie',
            radius: ['40%', '70%'],
            avoidLabelOverlap: false,
            label: {


                show: false,
                position: 'center'
            },
            emphasis: {


                label: {


                    show: true,
                    fontSize: '40',
                    fontWeight: 'bold'
                }
            },
            labelLine: {


                show: false
            },
            data: [
                {

    value: 522, name: '完成 62.51%',itemStyle: {


                    color:'#FFC851',
                    show: true,
                }},
                {

    value: 313, name: '未完成 37.49%' }
            ]
        }
    ]
};

option && myChart.setOption(option);
效果:
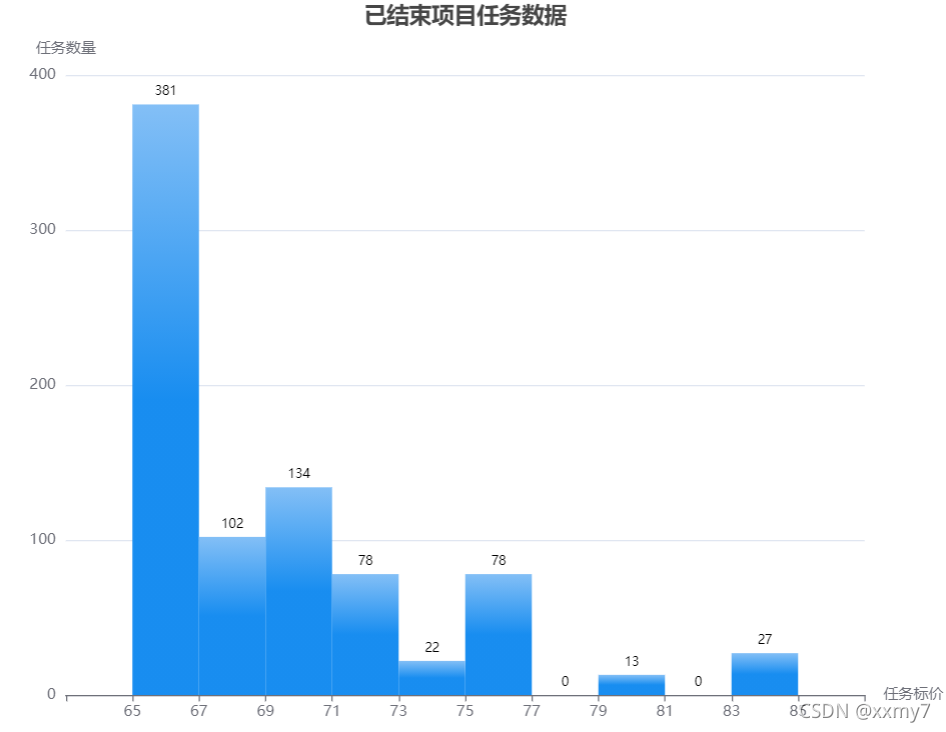
二、柱状图
(1)常规柱状图
示例编辑:
const xData = [' ','65', '67', '69', '71', '73', '75', '77','79','81','83','85',' '];
const barData = [' ','381', '102', '134', '78', '22', '78', '0','13','0','27',' '];

option = {


    title: {


        text: '已结束项目任务数据',
        left:'center'
    },
    xAxis: [{


            data: barData,
            show:false
        },
        {


            data: xData,
            axisLabel: {


                interval: 0,
                show: true,
            },
            position: 'bottom',
            boundaryGap: false,
            name:'任务标价'
        },
    ],
    yAxis: {


        type: 'value',
        show: true,
        name:'任务数量',
    },
    series: [{


         itemStyle: {


             showBackground: true,
              normal:{


                label: {


                    show: true, //开启显示
                    position: 'top', //在上方显示
                    textStyle: {

     //数值样式
                        color: 'black',
                        fontSize: 10
                    }
                },
                color: new echarts.graphic.LinearGradient(
                    0, 0, 0, 1,
                    [
                        {

    offset: 0, color: '#83bff6'},
                        {

    offset: 0.5, color: '#188df0'},
                        {

    offset: 1, color: '#188df0'}
                    ]
                ),

              },

            },
        data: [' ', 381, 102, 134, 78, 22, 78, 0,13,0,27],
        type: 'bar',
        barCategoryGap:'0',


    }, ],
}
完整代码:
import * as echarts from 'echarts';

var chartDom = document.getElementById('main');
var myChart = echarts.init(chartDom);
var option;

const xData = [' ','65', '67', '69', '71', '73', '75', '77','79','81','83','85',' '];
const barData = [' ','381', '102', '134', '78', '22', '78', '0','13','0','27',' '];

option = {


    title: {


        text: '已结束项目任务数据',
        left:'center'
    },
    xAxis: [{


            data: barData,
            show:false
        },
        {


            data: xData,
            axisLabel: {


                interval: 0,
                show: true,
            },
            position: 'bottom',
            boundaryGap: false,
            name:'任务标价'
        },
    ],
    yAxis: {


        type: 'value',
        show: true,
        name:'任务数量',
    },
    series: [{


         itemStyle: {


             showBackground: true,
              normal:{


                label: {


                    show: true, //开启显示
                    position: 'top', //在上方显示
                    textStyle: {

     //数值样式
                        color: 'black',
                        fontSize: 10
                    }
                },
                color: new echarts.graphic.LinearGradient(
                    0, 0, 0, 1,
                    [
                        {

    offset: 0, color: '#83bff6'},
                        {

    offset: 0.5, color: '#188df0'},
                        {

    offset: 1, color: '#188df0'}
                    ]
                ),

              },

            },
        data: [' ', 381, 102, 134, 78, 22, 78, 0,13,0,27],
        type: 'bar',
        barCategoryGap:'0',


    }, ],
}

option && myChart.setOption(option);
效果:
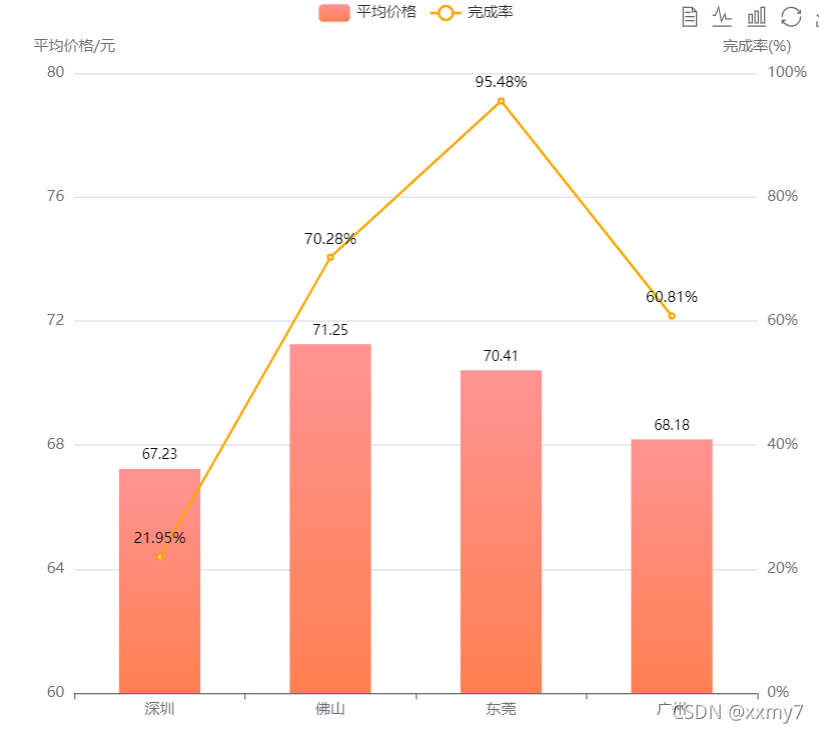
(2)折柱混合
示例编辑
option = {


    tooltip: {


        trigger: 'axis',
        axisPointer: {


            type: 'cross',
            crossStyle: {


                color: '#999'
            }
        }
    },
    toolbox: {


        feature: {


            dataView: {

    show: true, readOnly: false},
            magicType: {

    show: true, type: ['line', 'bar']},
            restore: {

    show: true},
            saveAsImage: {

    show: true}
        }
    },
    legend: {


        data: ['平均价格', '完成率']
    },
    xAxis: [
        {


            type: 'category',
            data: ['深圳', '佛山','东莞', '广州'],
            axisPointer: {


                type: 'shadow'
            }
        }
    ],
    yAxis: [
        {


            type: 'value',
            name: '平均价格/元',
            min: 60,
            max: 80,
            interval: 4,
            axisLabel: {


                formatter: '{value}'
            }
        },
        {


            type: 'value',
            name: '完成率(%)',
            min: 0,
            max: 100,
            interval: 20,
            axisLabel: {


                formatter: '{value}%'
            }
        }
    ],

    barWidth:65,

    series: [
        {


            name: '平均价格',
            type: 'bar',
            data: [67.23,71.25,70.41,68.18],
            itemStyle: {


                 normal:{


                    label: {


                        show: true, //开启显示
                        position: 'top', //在上方显示
                        textStyle: {

     //数值样式
                            color: 'black',
                            fontSize: 11
                        }
                    },
                    color: new echarts.graphic.LinearGradient(
                        0, 0, 0, 1,
                        [
                            {

    offset: 1, color: "#FF7F50"},
                            {

    offset: 0, color: "#FF9393"}
                        ]
                     ),
                }
            }
        },

        {


            name: '完成率',
            type: 'line',
            yAxisIndex: 1,
            //color: orange,
            data: [21.95,70.28,95.48,60.81],

             itemStyle: {


                 normal:{


                    label: {


                        show: true, //开启显示
                        position: 'top', //在上方显示
                        textStyle: {

     //数值样式
                            color: 'black',
                            fontSize: 12
                        },
                        formatter: function (value) {


                            var val = value.data;
                            val = val + '%';
                            return val;
                        },
                    },
                    color: "orange",

                },
            }

        }
    ]
};
完整代码:
import * as echarts from 'echarts';

var chartDom = document.getElementById('main');
var myChart = echarts.init(chartDom);
var option;

option = {


    tooltip: {


        trigger: 'axis',
        axisPointer: {


            type: 'cross',
            crossStyle: {


                color: '#999'
            }
        }
    },
    toolbox: {


        feature: {


            dataView: {

    show: true, readOnly: false},
            magicType: {

    show: true, type: ['line', 'bar']},
            restore: {

    show: true},
            saveAsImage: {

    show: true}
        }
    },
    legend: {


        data: ['平均价格', '完成率']
    },
    xAxis: [
        {


            type: 'category',
            data: ['深圳', '佛山','东莞', '广州'],
            axisPointer: {


                type: 'shadow'
            }
        }
    ],
    yAxis: [
        {


            type: 'value',
            name: '平均价格/元',
            min: 60,
            max: 80,
            interval: 4,
            axisLabel: {


                formatter: '{value}'
            }
        },
        {


            type: 'value',
            name: '完成率(%)',
            min: 0,
            max: 100,
            interval: 20,
            axisLabel: {


                formatter: '{value}%'
            }
        }
    ],

    barWidth:65,

    series: [
        {


            name: '平均价格',
            type: 'bar',
            data: [67.23,71.25,70.41,68.18],
            itemStyle: {


                 normal:{


                    label: {


                        show: true, //开启显示
                        position: 'top', //在上方显示
                        textStyle: {

     //数值样式
                            color: 'black',
                            fontSize: 11
                        }
                    },
                    color: new echarts.graphic.LinearGradient(
                        0, 0, 0, 1,
                        [
                            {

    offset: 1, color: "#FF7F50"},
                            {

    offset: 0, color: "#FF9393"}
                        ]
                     ),
                }
            }
        },

        {


            name: '完成率',
            type: 'line',
            yAxisIndex: 1,
            //color: orange,
            data: [21.95,70.28,95.48,60.81],

             itemStyle: {


                 normal:{


                    label: {


                        show: true, //开启显示
                        position: 'top', //在上方显示
                        textStyle: {

     //数值样式
                            color: 'black',
                            fontSize: 12
                        },
                        formatter: function (value) {


                            var val = value.data;
                            val = val + '%';
                            return val;
                        },
                    },
                    color: "orange",

                },
            }

        }
    ]
};

option && myChart.setOption(option);
效果:
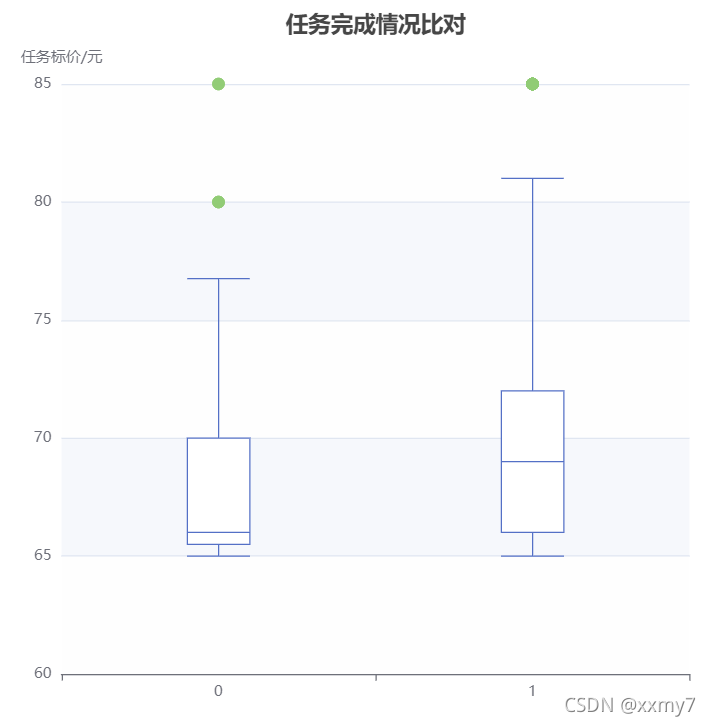
三、盒须图
示例编辑:
option = {


    title: [
        {


            text: '任务完成情况比对',
            left: 'center'
        },

    ],
    dataset: [{


        source: [
            [66,65.5,75,65.5,75,65.5,66,65.5,65.5,66,65.5,66.5,67.5,66,68,67,65.5,66.5,70,75,66.5,66,65,67,69,66,66,67,67,68.5,70,66.5,65.5,70,67,67,73,66,69,66,65.5,65.5,67.5,75,73,67,67,65,65.5,66,66.5,70,66.5,66,66.5,66.5,68.5,71,66,67,66,65.5,66,66.5,66,70,66.5,70,65.5,67,70,66,65.5,65.5,65.5,66,66,66.5,70,66,65,67.5,70,66,68.5,70.5,65.5,66.5,66.5,67,66,67,65.5,65.5,66,65.5,65,65.5,65,65,68.5,65.5,65.5,68,69,66.5,65,66,65,65,66,66,66,66,65.5,65.5,73.5,69,66,70,75,70,66,66.5,65.5,69,70,74.5,74,65.5,67.5,65.5,66.5,65.5,65,67.5,66,65,65.5,65,65,65.5,65.5,65,65,65.5,65.5,66.5,65,67,66,70,70,66,70,70,70,70,75,70,65.5,65.5,66,66.5,65,66.5,66.5,67,69,75,75,65.5,65.5,65.5,65,65,67.5,65.5,65.5,66,65.5,66,66,65.5,65.5,66,65.5,65,65.5,65.5,66.5,65.5,72.5,66.5,66,65.5,65.5,66,68,65,65.5,66,65.5,65.5,66.5,66,65.5,65.5,65.5,65,65,66,65,65,75,72,75,73.5,75,75,75,75,75,69.5,67,69,73,66.5,72,66.5,67,66,85,66,65.5,65.5,66,72,65,72,66.5,72,85,65,65.5,67,67,65.5,80,65,80,65,80,80,65.5,65.5,65.5,65.5,66,66,65.5,67,66,75,66,72.5,65,65.5,66.5,66,66,65.5,66,68,66,65.5,66,66,65.5,67,65.5,66,66,65.5,68,74,71.5,75,75,65.5,70.5,68.5,65.5,66.5,69.5,75,85,72,72,72,74,72,72,72,72,72,74,72,72,72,72,72,65.5
],
            [65.5,65.5,66,65.5,66,66,66,65.5,65.5,66,66,65,66,65.5,66.5,65.5,66,65.5,66.5,65.5,66.5,70,67,70,65.5,66,65,66.5,65.5,66,75,65.5,66.5,75,65.5,73,66.5,70.5,67,66.5,70,67,65.5,65.5,65.5,69.5,65.5,66,75,74.5,75,67,70,66.5,66.5,70,70,75,70,67,68,70.5,66,70.5,65,75,75,70,65.5,70,66,70,70,70,70,70,70,66,70,65,71.5,70,66,65.5,65,65.5,65,65.5,65,66.5,68,65.5,65,65,65.5,65.5,67,70,70.5,66,72,68,67,65,66.5,70,66,67,65.5,66.5,68,65,65.5,65.5,69,70,65,67.5,70,70,70,75,70,70,70,70,75,70,66.5,70,70,70,65.5,66.5,70,65.5,66,65.5,65.5,65.5,65,69,65.5,65,65.5,65,65.5,65,65.5,65,69,65.5,65.5,65,65,65.5,69,66.5,66,65.5,65.5,65.5,65.5,65.5,68,75,65,66,65,66,65.5,75,75,65.5,72,65.5,74,65,75,66,65.5,72,75,75,75,65,66,68,72,73,65,75,75,65,65.5,65.5,72,65.5,65.5,75,65,70,65.5,66.5,65.5,75,65.5,80,66,75,75,66,75,65,65.5,65.5,72,65.5,65.5,75,66,65,65.5,65,66,66.5,80,65.5,70,70.5,72,66.5,70.5,71.5,70,66.5,69,67.5,68.5,70,70,67.5,70,70,70,70,68,69.5,67.5,72.5,65,70,67,67,66,72.5,68.5,66,69.5,67.5,69,66.5,65.5,70,75,65,68,66.5,69,67,69.5,65.5,71,68,68,67,66,67.5,66,67,70,75,70,70,75,70,70,75,75,70,69.5,70,70.5,68,66.5,67.5,67,70,66.5,75,66.5,71.5,73,73.5,75,70,73.5,70,66,73,66.5,75,66.5,66.5,70,67.5,65.5,73.5,67.5,67.5,72.5,66,65.5,70,73,68,75,73,65,66,70,70,67,65.5,70,69,70,67,70,69,72,70,70,65,70,65,66,68.5,67.5,66.5,70,71.5,70,65.5,65.5,75,70,75,68,75,69,67.5,69.5,68,70,68.5,68,70,67.5,70.5,69,70.5,75,72.5,75,68,70,68,70,72.5,70,70,70,67.5,71,67,72,68,66,66.5,70,66.5,72,75,72,72.5,72,75,75,68,68,72,68,75,66,72,65.5,75,69,75,68.5,75,72,75,65.5,72,75,72,68,66,72,75,72,75,72,75,75,75,65.5,68.5,75,75,72,72,72.5,73,66,75,75,72,75,68,85,80,66,85,72,72,75,66.5,66,68,85,85,85,65,66.5,65.5,72,67.5,75,72,67,85,72,66,72,66,85,72,70,72,66.5,65.5,72,66.5,85,72,85,66,85,80,72,72,72,67.5,70,68,66,80,71,85,85,85,66.5,85,85,70,85,85,85,67.5,85,72,80,72,72,80,72,65.5,85,85,72,80,65.5,66,80,85,72,85,65.5,85
],
            ]
    },
    {


        transform: {


            type: 'boxplot',
            //config: { itemNameFormatter: 'expr {value}' }
        }
    }, {


        fromDatasetIndex: 1,
        fromTransformResult: 1
    }
    ],

    tooltip: {


        trigger: 'item',
        axisPointer: {


            type: 'shadow'
        }
    },
    grid: {


        left: '10%',
        right: '10%',
        bottom: '15%'
    },


     series: [
        {


            name: 'boxplot',
            type: 'boxplot',
            datasetIndex: 1
        },
        {


            name: 'outlier',
            type: 'scatter',
            datasetIndex: 2
        }
    ],
    xAxis: {


        type: 'category',
        boundaryGap: true,
        nameGap: 30,
        splitArea: {


            show: false
        },
        splitLine: {


            show: false
        },
        //data:['完成','未完成']

    },
    yAxis: {


        min:60,
        interval: 5,
        type: 'value',
        name: '任务标价/元',
        splitArea: {


            show: true
        }
    },

};
完整代码:
import * as echarts from 'echarts';

var chartDom = document.getElementById('main');
var myChart = echarts.init(chartDom);
var option;

option = {


    title: [
        {


            text: '任务完成情况比对',
            left: 'center'
        },

    ],
    dataset: [{


        source: [
            [66,65.5,75,65.5,75,65.5,66,65.5,65.5,66,65.5,66.5,67.5,66,68,67,65.5,66.5,70,75,66.5,66,65,67,69,66,66,67,67,68.5,70,66.5,65.5,70,67,67,73,66,69,66,65.5,65.5,67.5,75,73,67,67,65,65.5,66,66.5,70,66.5,66,66.5,66.5,68.5,71,66,67,66,65.5,66,66.5,66,70,66.5,70,65.5,67,70,66,65.5,65.5,65.5,66,66,66.5,70,66,65,67.5,70,66,68.5,70.5,65.5,66.5,66.5,67,66,67,65.5,65.5,66,65.5,65,65.5,65,65,68.5,65.5,65.5,68,69,66.5,65,66,65,65,66,66,66,66,65.5,65.5,73.5,69,66,70,75,70,66,66.5,65.5,69,70,74.5,74,65.5,67.5,65.5,66.5,65.5,65,67.5,66,65,65.5,65,65,65.5,65.5,65,65,65.5,65.5,66.5,65,67,66,70,70,66,70,70,70,70,75,70,65.5,65.5,66,66.5,65,66.5,66.5,67,69,75,75,65.5,65.5,65.5,65,65,67.5,65.5,65.5,66,65.5,66,66,65.5,65.5,66,65.5,65,65.5,65.5,66.5,65.5,72.5,66.5,66,65.5,65.5,66,68,65,65.5,66,65.5,65.5,66.5,66,65.5,65.5,65.5,65,65,66,65,65,75,72,75,73.5,75,75,75,75,75,69.5,67,69,73,66.5,72,66.5,67,66,85,66,65.5,65.5,66,72,65,72,66.5,72,85,65,65.5,67,67,65.5,80,65,80,65,80,80,65.5,65.5,65.5,65.5,66,66,65.5,67,66,75,66,72.5,65,65.5,66.5,66,66,65.5,66,68,66,65.5,66,66,65.5,67,65.5,66,66,65.5,68,74,71.5,75,75,65.5,70.5,68.5,65.5,66.5,69.5,75,85,72,72,72,74,72,72,72,72,72,74,72,72,72,72,72,65.5
],
            [65.5,65.5,66,65.5,66,66,66,65.5,65.5,66,66,65,66,65.5,66.5,65.5,66,65.5,66.5,65.5,66.5,70,67,70,65.5,66,65,66.5,65.5,66,75,65.5,66.5,75,65.5,73,66.5,70.5,67,66.5,70,67,65.5,65.5,65.5,69.5,65.5,66,75,74.5,75,67,70,66.5,66.5,70,70,75,70,67,68,70.5,66,70.5,65,75,75,70,65.5,70,66,70,70,70,70,70,70,66,70,65,71.5,70,66,65.5,65,65.5,65,65.5,65,66.5,68,65.5,65,65,65.5,65.5,67,70,70.5,66,72,68,67,65,66.5,70,66,67,65.5,66.5,68,65,65.5,65.5,69,70,65,67.5,70,70,70,75,70,70,70,70,75,70,66.5,70,70,70,65.5,66.5,70,65.5,66,65.5,65.5,65.5,65,69,65.5,65,65.5,65,65.5,65,65.5,65,69,65.5,65.5,65,65,65.5,69,66.5,66,65.5,65.5,65.5,65.5,65.5,68,75,65,66,65,66,65.5,75,75,65.5,72,65.5,74,65,75,66,65.5,72,75,75,75,65,66,68,72,73,65,75,75,65,65.5,65.5,72,65.5,65.5,75,65,70,65.5,66.5,65.5,75,65.5,80,66,75,75,66,75,65,65.5,65.5,72,65.5,65.5,75,66,65,65.5,65,66,66.5,80,65.5,70,70.5,72,66.5,70.5,71.5,70,66.5,69,67.5,68.5,70,70,67.5,70,70,70,70,68,69.5,67.5,72.5,65,70,67,67,66,72.5,68.5,66,69.5,67.5,69,66.5,65.5,70,75,65,68,66.5,69,67,69.5,65.5,71,68,68,67,66,67.5,66,67,70,75,70,70,75,70,70,75,75,70,69.5,70,70.5,68,66.5,67.5,67,70,66.5,75,66.5,71.5,73,73.5,75,70,73.5,70,66,73,66.5,75,66.5,66.5,70,67.5,65.5,73.5,67.5,67.5,72.5,66,65.5,70,73,68,75,73,65,66,70,70,67,65.5,70,69,70,67,70,69,72,70,70,65,70,65,66,68.5,67.5,66.5,70,71.5,70,65.5,65.5,75,70,75,68,75,69,67.5,69.5,68,70,68.5,68,70,67.5,70.5,69,70.5,75,72.5,75,68,70,68,70,72.5,70,70,70,67.5,71,67,72,68,66,66.5,70,66.5,72,75,72,72.5,72,75,75,68,68,72,68,75,66,72,65.5,75,69,75,68.5,75,72,75,65.5,72,75,72,68,66,72,75,72,75,72,75,75,75,65.5,68.5,75,75,72,72,72.5,73,66,75,75,72,75,68,85,80,66,85,72,72,75,66.5,66,68,85,85,85,65,66.5,65.5,72,67.5,75,72,67,85,72,66,72,66,85,72,70,72,66.5,65.5,72,66.5,85,72,85,66,85,80,72,72,72,67.5,70,68,66,80,71,85,85,85,66.5,85,85,70,85,85,85,67.5,85,72,80,72,72,80,72,65.5,85,85,72,80,65.5,66,80,85,72,85,65.5,85
],
            ]
    },
    {


        transform: {


            type: 'boxplot',
            //config: { itemNameFormatter: 'expr {value}' }
        }
    }, {


        fromDatasetIndex: 1,
        fromTransformResult: 1
    }
    ],

    tooltip: {


        trigger: 'item',
        axisPointer: {

    效果:
            type: 'shadow'
        }
    },
    grid: {


        left: '10%',
        right: '10%',
        bottom: '15%'
    },


     series: [
        {


            name: 'boxplot',
            type: 'boxplot',
            datasetIndex: 1
        },
        {


            name: 'outlier',
            type: 'scatter',
            datasetIndex: 2
        }
    ],
    xAxis: {


        type: 'category',
        boundaryGap: true,
        nameGap: 30,
        splitArea: {


            show: false
        },
        splitLine: {


            show: false
        },
        //data:['完成','未完成']

    },
    yAxis: {


        min:60,
        interval: 5,
        type: 'value',
        name: '任务标价/元',
        splitArea: {


            show: true
        }
    },

};

option && myChart.setOption(option);
效果:
option = {


  title: {


    //text: '执行时间'
  },
  tooltip: {


    trigger: 'axis'
  },
  legend: {


    //data: ['Email', 'Union Ads', 'Video Ads', 'Direct', 'Search Engine']
  },
  // grid: {


  //   left: '3%',
  //   right: '4%',
  //   bottom: '3%',
  //   containLabel: true
  // },
  toolbox: {


    feature: {


      saveAsImage: {

    }
    }
  },
  xAxis: {


    name:'线程个数',

    type: 'category',
    axisLine: {


        onZero: false,
      },
    axisTick: {


      alignWithLabel: true
    },
    axisLabel: {


      interval:0,
    },

    //boundaryGap:false,
    data: ['2', '3', '4', '5', '6', '7','8','9','10','11','12']

  },

  yAxis: {


    name:'加速比',
    type: 'value'
  },
  series: [
    {


      //name: 'Email',
      type: 'line',
      stack: 'Total',
      color:'#EE7656',
      itemStyle : {


        normal: {


          label : {

    show: true}
        }
      },
      data: [1.935,2.782,	3.611,	4.338,	4.909,	5.382,	5.977,	6.268,	6.999,	6.800,	6.999]
    },

  ]
};
