由于项目需要一个数据大屏页面,所以今天学习了vue结合echarts的图标绘制
首先需要安装ECharts
npm install echarts --save
因为只是在数据大屏页面绘制图表,所以我们无需把它设置为全局变量。
可以直接在该页面引入echarts,就可以在数据大屏页面使用echarts的所有组件了
import * as echarts from "echarts";
且echart自带明亮和黑暗主题,可以一句代码进行设置
//明亮
var chart = echarts.init(dom, 'light');

//黑暗
var chart = echarts.init(dom, 'dark');
示例;
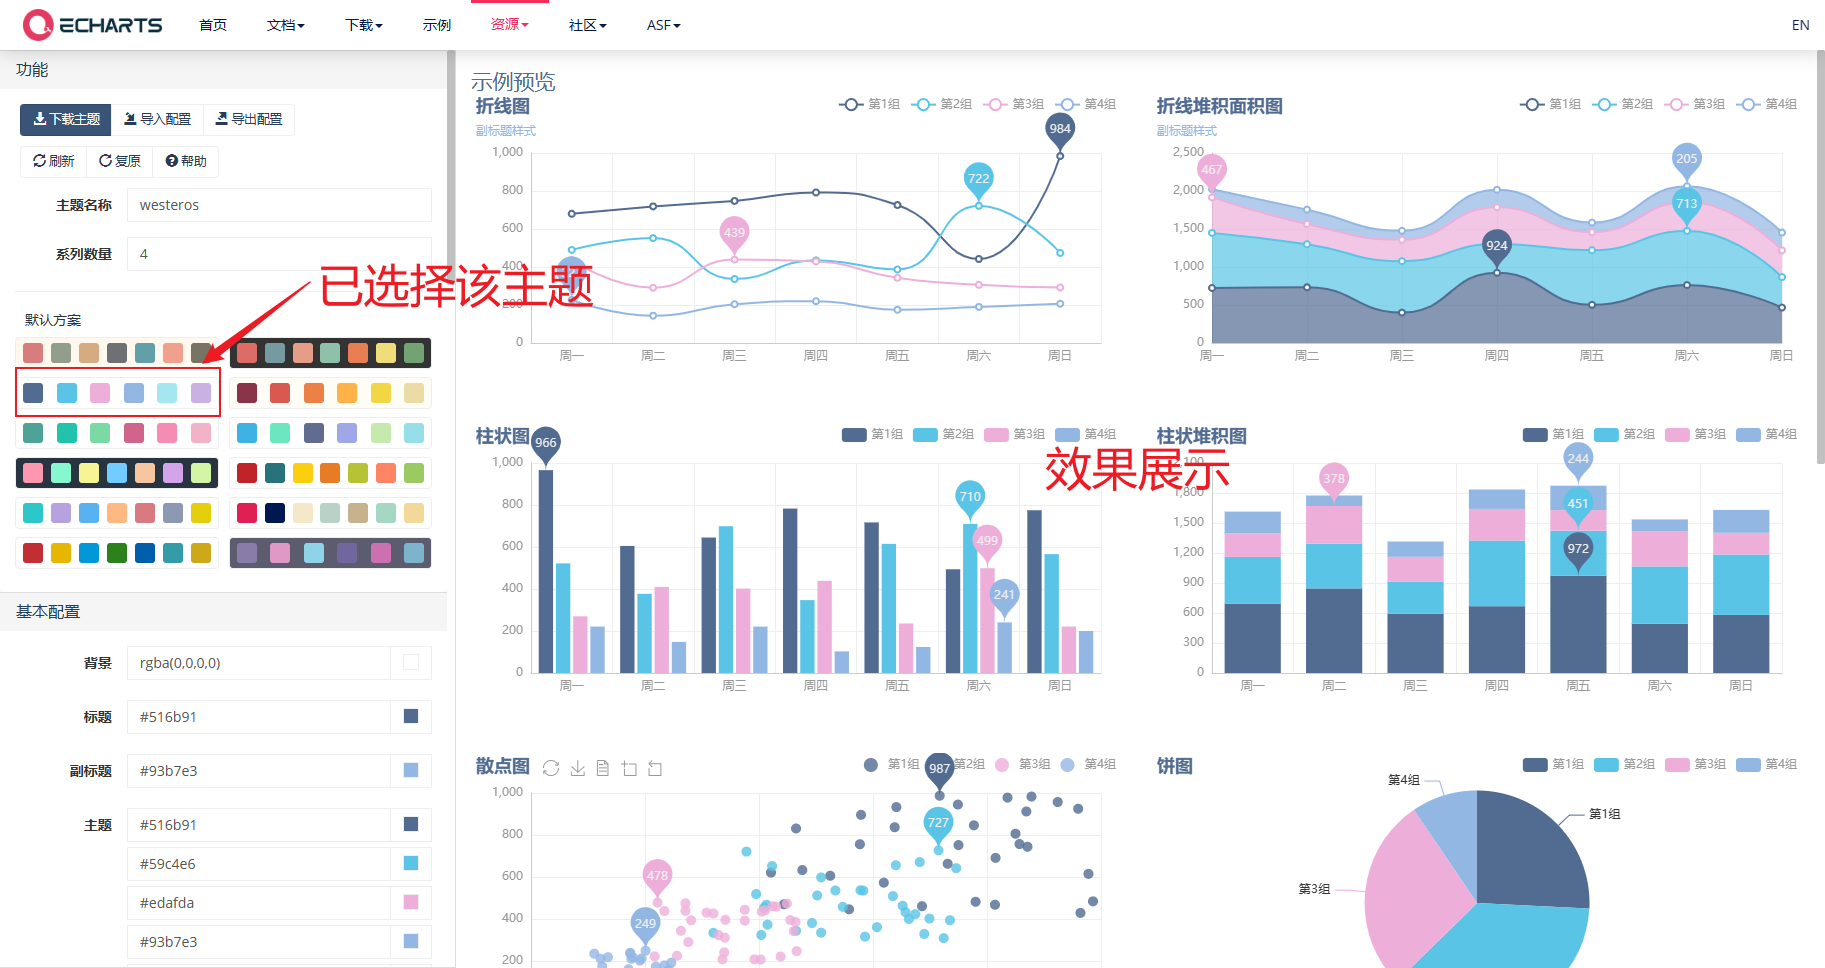
还可以使用主题编辑器根据需要修改图标的样式主题颜色
自定义好主题之后可以导出主题代码保存为一个js文件,引入目标页面在代码中使用该主题
vue结合echart主题编辑器的使用方法如下:
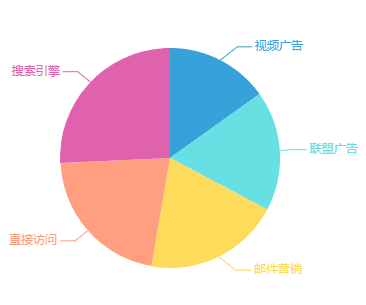
示例:原本我写的示例代码里默认样式长这样
首先我们去主题编辑器里选择好一个主题,下载它的json版本代码
点击左上角的【下载主题】

复制,点击复制后官方文档还贴心的给出了提示【已复制到剪贴板,请保持至*.json文件】
那么我们就到vue中创建一个js文件把我们复制的代码放进去备用

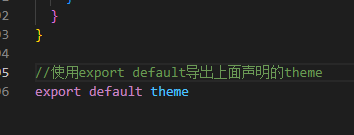
别忘了js文件末尾要记得声明
接着需要使用该主题的vue文件中导入主题
第一步:引入js文件
import theme from './echarts_test' 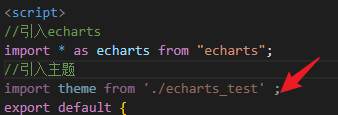
第二步: 注册主题
ECharts.registerTheme('chalk',chalk);第三步:给init传入第二个参数,使用主题
this.myChart = ECharts.init(document.getElementById('main'),'chalk');完成!
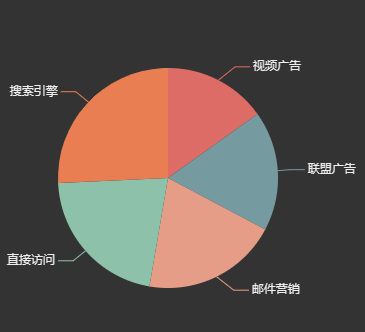
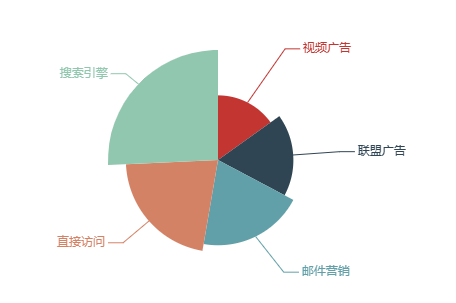
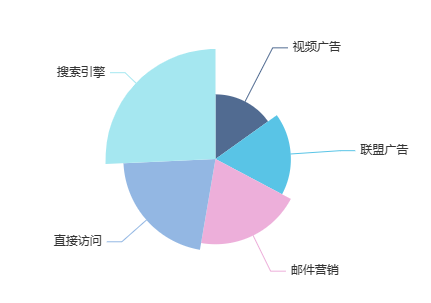
实现效果:

变成了⬇⬇⬇⬇⬇⬇⬇⬇
最后再贴个代码吧
主题配置:
//将下载的主题json文件放入const theme ={}中
const theme = {
  "color": [
    "#516b91",
    "#59c4e6",
    "#edafda",
    "#93b7e3",
    "#a5e7f0",
    "#cbb0e3"
  ],
  "backgroundColor": "rgba(0,0,0,0)",
  "textStyle": {},
  "title": {
    "textStyle": {
      "color": "#516b91"
    },
    "subtextStyle": {
      "color": "#93b7e3"
    }
  },
  "line": {
    "itemStyle": {
      "borderWidth": "2"
    },
    "lineStyle": {
      "width": "2"
    },
    "symbolSize": "6",
    "symbol": "emptyCircle",
    "smooth": true
  },
  "radar": {
    "itemStyle": {
      "borderWidth": "2"
    },
    "lineStyle": {
      "width": "2"
    },
    "symbolSize": "6",
    "symbol": "emptyCircle",
    "smooth": true
  },
  "bar": {
    "itemStyle": {
      "barBorderWidth": 0,
      "barBorderColor": "#ccc"
    }
  },
  "pie": {
    "itemStyle": {
      "borderWidth": 0,
      "borderColor": "#ccc"
    }
  },
  "scatter": {
    "itemStyle": {
      "borderWidth": 0,
      "borderColor": "#ccc"
    }
  },
  "boxplot": {
    "itemStyle": {
      "borderWidth": 0,
      "borderColor": "#ccc"
    }
  },
  "parallel": {
    "itemStyle": {
      "borderWidth": 0,
      "borderColor": "#ccc"
    }
  },
  "sankey": {
    "itemStyle": {
      "borderWidth": 0,
      "borderColor": "#ccc"
    }
  },
  "funnel": {
    "itemStyle": {
      "borderWidth": 0,
      "borderColor": "#ccc"
    }
  },
  "gauge": {
    "itemStyle": {
      "borderWidth": 0,
      "borderColor": "#ccc"
    }
  },
  "candlestick": {
    "itemStyle": {
      "color": "#edafda",
      "color0": "transparent",
      "borderColor": "#d680bc",
      "borderColor0": "#8fd3e8",
      "borderWidth": "2"
    }
  },
  "graph": {
    "itemStyle": {
      "borderWidth": 0,
      "borderColor": "#ccc"
    },
    "lineStyle": {
      "width": 1,
      "color": "#aaaaaa"
    },
    "symbolSize": "6",
    "symbol": "emptyCircle",
    "smooth": true,
    "color": [
      "#516b91",
      "#59c4e6",
      "#edafda",
      "#93b7e3",
      "#a5e7f0",
      "#cbb0e3"
    ],
    "label": {
      "color": "#eeeeee"
    }
  },
  "map": {
    "itemStyle": {
      "areaColor": "#f3f3f3",
      "borderColor": "#516b91",
      "borderWidth": 0.5
    },
    "label": {
      "color": "#000"
    },
    "emphasis": {
      "itemStyle": {
        "areaColor": "#a5e7f0",
        "borderColor": "#516b91",
        "borderWidth": 1
      },
      "label": {
        "color": "#516b91"
      }
    }
  },
  "geo": {
    "itemStyle": {
      "areaColor": "#f3f3f3",
      "borderColor": "#516b91",
      "borderWidth": 0.5
    },
    "label": {
      "color": "#000"
    },
    "emphasis": {
      "itemStyle": {
        "areaColor": "#a5e7f0",
        "borderColor": "#516b91",
        "borderWidth": 1
      },
      "label": {
        "color": "#516b91"
      }
    }
  },
  "categoryAxis": {
    "axisLine": {
      "show": true,
      "lineStyle": {
        "color": "#cccccc"
      }
    },
    "axisTick": {
      "show": false,
      "lineStyle": {
        "color": "#333"
      }
    },
    "axisLabel": {
      "show": true,
      "color": "#999999"
    },
    "splitLine": {
      "show": true,
      "lineStyle": {
        "color": [
          "#eeeeee"
        ]
      }
    },
    "splitArea": {
      "show": false,
      "areaStyle": {
        "color": [
          "rgba(250,250,250,0.05)",
          "rgba(200,200,200,0.02)"
        ]
      }
    }
  },
  "valueAxis": {
    "axisLine": {
      "show": true,
      "lineStyle": {
        "color": "#cccccc"
      }
    },
    "axisTick": {
      "show": false,
      "lineStyle": {
        "color": "#333"
      }
    },
    "axisLabel": {
      "show": true,
      "color": "#999999"
    },
    "splitLine": {
      "show": true,
      "lineStyle": {
        "color": [
          "#eeeeee"
        ]
      }
    },
    "splitArea": {
      "show": false,
      "areaStyle": {
        "color": [
          "rgba(250,250,250,0.05)",
          "rgba(200,200,200,0.02)"
        ]
      }
    }
  },
  "logAxis": {
    "axisLine": {
      "show": true,
      "lineStyle": {
        "color": "#cccccc"
      }
    },
    "axisTick": {
      "show": false,
      "lineStyle": {
        "color": "#333"
      }
    },
    "axisLabel": {
      "show": true,
      "color": "#999999"
    },
    "splitLine": {
      "show": true,
      "lineStyle": {
        "color": [
          "#eeeeee"
        ]
      }
    },
    "splitArea": {
      "show": false,
      "areaStyle": {
        "color": [
          "rgba(250,250,250,0.05)",
          "rgba(200,200,200,0.02)"
        ]
      }
    }
  },
  "timeAxis": {
    "axisLine": {
      "show": true,
      "lineStyle": {
        "color": "#cccccc"
      }
    },
    "axisTick": {
      "show": false,
      "lineStyle": {
        "color": "#333"
      }
    },
    "axisLabel": {
      "show": true,
      "color": "#999999"
    },
    "splitLine": {
      "show": true,
      "lineStyle": {
        "color": [
          "#eeeeee"
        ]
      }
    },
    "splitArea": {
      "show": false,
      "areaStyle": {
        "color": [
          "rgba(250,250,250,0.05)",
          "rgba(200,200,200,0.02)"
        ]
      }
    }
  },
  "toolbox": {
    "iconStyle": {
      "borderColor": "#999999"
    },
    "emphasis": {
      "iconStyle": {
        "borderColor": "#666666"
      }
    }
  },
  "legend": {
    "textStyle": {
      "color": "#999999"
    }
  },
  "tooltip": {
    "axisPointer": {
      "lineStyle": {
        "color": "#cccccc",
        "width": 1
      },
      "crossStyle": {
        "color": "#cccccc",
        "width": 1
      }
    }
  },
  "timeline": {
    "lineStyle": {
      "color": "#8fd3e8",
      "width": 1
    },
    "itemStyle": {
      "color": "#8fd3e8",
      "borderWidth": 1
    },
    "controlStyle": {
      "color": "#8fd3e8",
      "borderColor": "#8fd3e8",
      "borderWidth": 0.5
    },
    "checkpointStyle": {
      "color": "#8fd3e8",
      "borderColor": "#8a7ca8"
    },
    "label": {
      "color": "#8fd3e8"
    },
    "emphasis": {
      "itemStyle": {
        "color": "#8fd3e8"
      },
      "controlStyle": {
        "color": "#8fd3e8",
        "borderColor": "#8fd3e8",
        "borderWidth": 0.5
      },
      "label": {
        "color": "#8fd3e8"
      }
    }
  },
  "visualMap": {
    "color": [
      "#516b91",
      "#59c4e6",
      "#a5e7f0"
    ]
  },
  "dataZoom": {
    "backgroundColor": "rgba(0,0,0,0)",
    "dataBackgroundColor": "rgba(255,255,255,0.3)",
    "fillerColor": "rgba(167,183,204,0.4)",
    "handleColor": "#a7b7cc",
    "handleSize": "100%",
    "textStyle": {
      "color": "#333"
    }
  },
  "markPoint": {
    "label": {
      "color": "#eeeeee"
    },
    "emphasis": {
      "label": {
        "color": "#eeeeee"
      }
    }
  }
}

//使用export default导出上面声明的主题
export default theme
可视化组件实现vue页面:
<template>
  <div
    class="echart"
    id="mychart"
    :style="{ float: 'left', width: '100%', height: '400px' }"
  ></div>
</template>

<script>
//引入echarts
import * as echarts from "echarts";
//引入主题
import theme from './echarts_test'
export default {
  data() {
    return {
      name: "张雪",
      xData: ["2020-02", "2020-03", "2020-04", "2020-05"], //横坐标数据
      yData: [30, 132, 80, 134] //纵坐标数据,与横坐标对应
    };
  },
  mounted() {
    this.initEcharts();
  },
  methods: {
    initEcharts() {
      var option = {
                series : [
                    {
                        name: '访问来源',
                        type: 'pie',
                        radius: '55%',
                        roseType: 'angle',
                        data:[
                            {value:235, name:'视频广告'},
                            {value:274, name:'联盟广告'},
                            {value:310, name:'邮件营销'},
                            {value:335, name:'直接访问'},
                            {value:400, name:'搜索引擎'}
                        ]
                    }
                ]
            };


      echarts.registerTheme('theme',theme);//注册主题
      const myChart = echarts.init(document.getElementById('mychart'),'theme');// 图标初始化

      myChart.setOption(option);// 渲染页面
      //随着屏幕大小调节图表
      window.addEventListener("resize", () => {
        myChart.resize();
      });
    }
  }
};
</script>