TeeChart for .NET v2023 [13 APR 2023] RELEASE 2023.4.13
TeeChart charting controls for .NET offer a great generic component suite for a myriad of charting requirements, targeting too, important vertical areas such as the financial, scientific and statistical worlds.
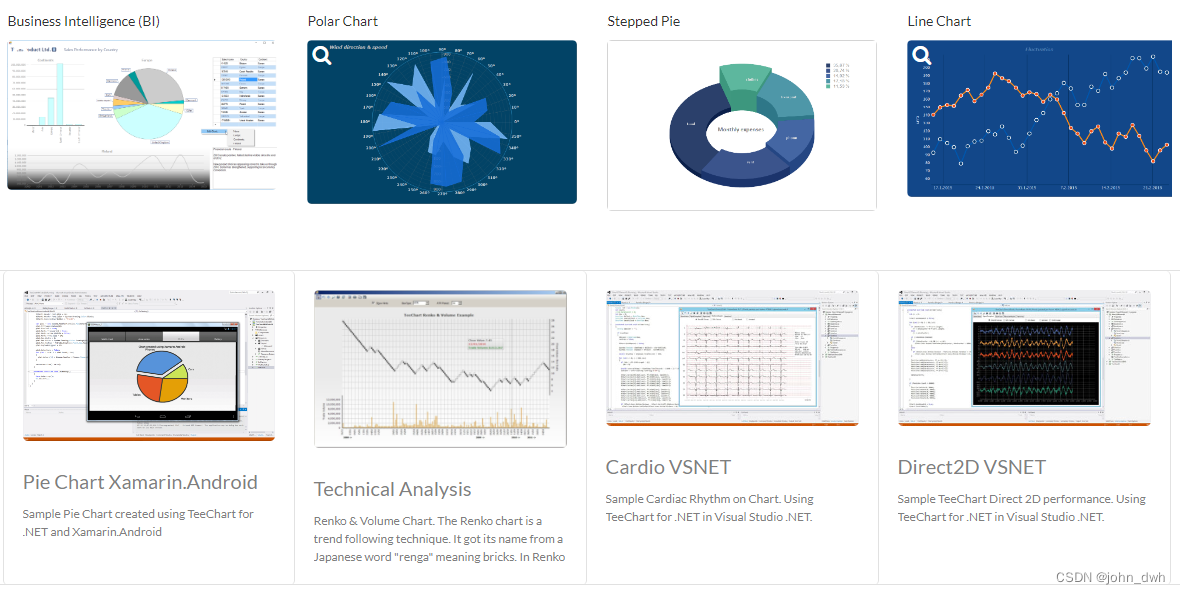
Data Visualisation
Dozens of fully customizable and interactive chart types, maps and gauge indicators, plus a complete featureset to help build powerful c# charting apps for web, desktop and mobile.
Easy to Use
You'll see how easy it is to code TeeChart and how you can improve department development productivity. Full c# chart source code available.
Priced Right for You
Find assemblies for WinFoms, WPF, ASP.NET, MVC, .NET Core, HTML5 Javascript, Xamarin and UWP. We offer Business, Pro & Enterprise Editions to better fit needs & budget.
A Superlative in Charting
With more than 25 years of charting development behind TeeChart, it is simply one of the most extensive charting libraries for .NET that you can lay your hands on.
A quick glance
Flexible data visualisation
for WinForms, WPF, ASP.NET and Xamarin
The chart component for .NET handles your data, creating informative and attractive graphs, seamlessly across a variety of platforms including: Windows Forms, WPF, ASP.NET (& ASP.NET Core, NET5+) with HTML5 /Javascript rendering and Universal Windows Platform (UWP).
The c# chart library code may be reused with Steema's mobile TeeChart products for Xamarin to reach Android, iOS and Windows Phone directly or via Xamarin's Forms PCL platform.

Informative data visualisations for Windows Forms and Universal Windows Platform.

Point & Figure graph. Point & Figure is made of X's and O's symbols representing over time filtered price movements.
Tracking financial data
Many mathematical indicators, statistical functions and more
The .NET chart control is packed with functionality to produce high-class financial charting applications. Functions and indicators include: Open-High-Low-Close Series, Candle, Volume and Moving Average Convergence/Divergence (MACD), ADX, Stochastic, Bollinger Bands, Renko, Kagi, Momentum, Moving Average and many more statistical functions.
Web charts - Blazor - MVC
ASP.NET Core, MVC & Blazor charts as HTML5 Javascript
The ASP.NET Web chart component may be placed on the WebForm panel for full in-place editing or be used within an MVC Blazor project. You can render your web charts either as static or ajax enhanced images or take advantage of TeeChart's comprehensive, client-side HTML5 Javascript library to render fully interactive .NET charts for MVC & ASP.NET.
See Blazor charts demo where you will find live chart examples.

Chart plots anomalies detected in data using TeeChart & Steema Numerics with ML.Net.
Predictive & Anomaly Detection
Machine Learning algorithm interface for TeeChart for .NET
We have prepared a module to link directly to Microsoft's ML.Net Machine-Learning framework with prepared and optimised predictive and anomaly detection algorithms. See the blog article. Save valuable learning-curve time delivering data insight to your customers.