一、svg绘制图形
像素图由一个个像素块组成,矢量图由多个数学公式绘制曲线组成,这样即使我们缩放,数学公式会重新计算,所以矢量图不会出现失真。

<!DOCTYPE html>
<html lang="en">

<head>
  <meta charset="UTF-8">
  <meta http-equiv="X-UA-Compatible" content="IE=edge">
  <meta name="viewport" content="width=device-width, initial-scale=1.0">
  <title>svg绘制图形</title>
</head>

<body>
  <svg width="1000" height="600">
    <!-- 01 绘制矩形 -->
    <!-- <rect x="40" y="40" width="300" height="200" style="fill:orangered; stroke: pink; stroke-width: 4"></rect> -->

    <!-- 02 绘制圆角矩形 -->
    <!-- <rect x="40" y="40" width="300" rx="20" ry="20" height="200" style="fill:orangered; stroke: pink; stroke-width: 4">
    </rect> -->

    <!-- 03 绘制圆形 -->
    <!-- <circle cx="200" cy="200" r="100" style="fill: darkblue"></circle> -->

    <!-- 04 椭圆 -->
    <!-- <ellipse cx="200" cy="200" rx="80" ry="40" style="fill: seagreen"></ellipse> -->

    <!-- 05 绘制线条 -->
    <!-- <line x1="100" y1="40" x2="500" y2="60" style="stroke:#333; stroke-width: 4"></line> -->

    <!-- 06 绘制多边形 -->
    <polygon points="200, 40, 400, 50, 100, 50" style="fill: lightblue; stroke-width: 2; stroke: red"
      transform="translate(100, 100)"></polygon>

    <!-- 07 绘制文字 -->
    <text x="200" y="200" style="fill: orange; font-size: 40" textLength="200">拉勾教育</text>

  </svg>
</body>

</html>
二、D3.js使用
https://d3js.org/
D3js 是一个可以基于数据来操作文档的 JavaScript 库。可以帮助你使用 HTML, CSS, SVG 以及 Canvas 来展示数据。D3 遵循现有的 Web 标准,可以不需要其他任何框架独立运行在现代浏览器中,它结合强大的可视化组件来驱动 DOM 操作。
<!DOCTYPE html>
<html lang="en">

<head>
  <meta charset="UTF-8">
  <meta http-equiv="X-UA-Compatible" content="IE=edge">
  <meta name="viewport" content="width=device-width, initial-scale=1.0">
  <title>D3.js使用</title>
  <script src="./d3.min.js"></script>
</head>

<body>
  <script>
    const data = [100, 20, 30, 50]

    d3.select('body').selectAll('p')
      .data(data)
      .enter()
      .append('p')
      .text('test')
  </script>
</body>

</html>
三、D3操作svg
<!DOCTYPE html>
<html lang="en">
<head>
<meta charset="UTF-8">
<meta http-equiv="X-UA-Compatible" content="IE=edge">
<meta name="viewport" content="width=device-width, initial-scale=1.0">
<title>d3操作svg</title>
<script src="./d3.min.js"></script>
</head>
<body>
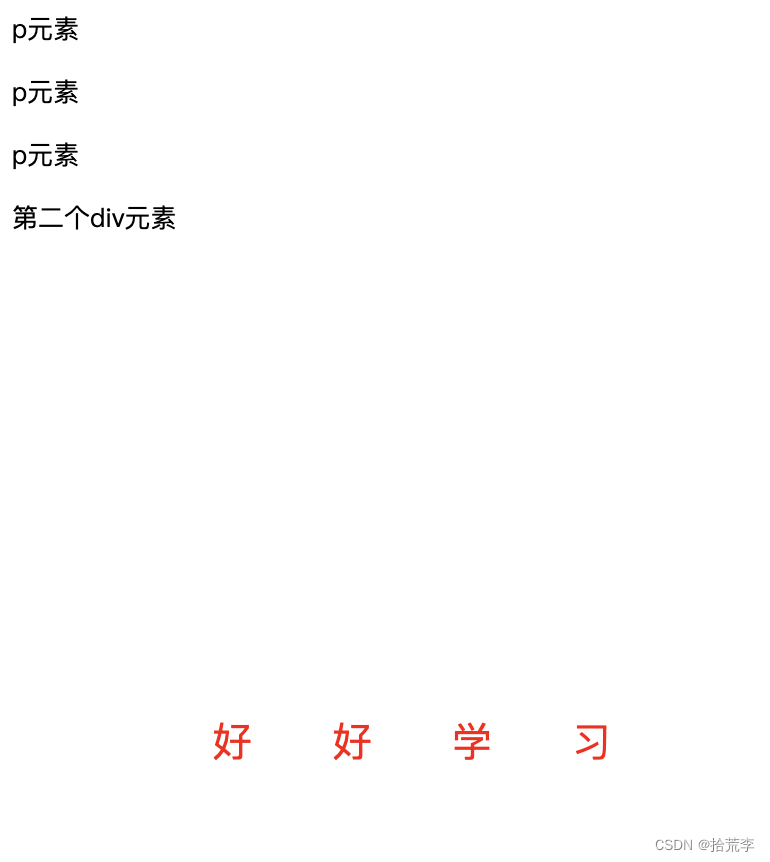
<div id="box">
<p>p元素</p>
<p>p元素</p>
<p>p元素</p>
</div>
<div>第二个div元素</div>
<svg width="600" height="400">
<rect x="100" y="100" width="200" height="100" style=" stroke:red; stroke-width: 4"></rect>
</svg>
<script>
// 01 d3 获取元素
console.log(d3.select('#box'))
console.log(d3.select('#box p'))
console.log(d3.selectAll('#box p'))
console.log(d3.selectAll('div'))
// 02 获取元素属性
console.log(+d3.select('rect').attr('width') === 300)
// 03 设置属性
// d3.select('rect')
// .attr('fill', 'seagreen')
// .attr('transform', 'translate(100, 100)')
// 04 添加删除元素
d3.select('svg').append('rect')
.attr('x', 100)
.attr('y', '200')
.attr('width', '200')
.attr('height', '100')
.attr('fill', 'lightblue')
d3.select('svg').append('text')
.attr('x', 100)
.attr('y', 260)
.attr('fill', 'red')
.attr('font-size', 20)
.attr('textLength', 200)
.text('好好学习')
// 05 删除元素
d3.selectAll('rect').remove()
</script>
</body>
</html>
四、D3绑定数据
<!DOCTYPE html>
<html lang="en">
<head>
<meta charset="UTF-8">
<meta http-equiv="X-UA-Compatible" content="IE=edge">
<meta name="viewport" content="width=device-width, initial-scale=1.0">
<title>绑定数据</title>
<script src="./d3.min.js"></script>
</head>
<body>
<script>
// 01 添加 svg
d3.select('body').append('svg')
.attr('width', 600)
.attr('height', 400)
// 02 绘制圆形1
// d3.select('svg').append('circle')
// .attr('cx', 100)
// .attr('cy', 100)
// .attr('r', 10)
// .attr('fill', 'orange')
// d3.select('svg').append('circle')
// .attr('cx', 120)
// .attr('cy', 130)
// .attr('r', 20)
// .attr('fill', 'seagreen')
// 03 定义数据
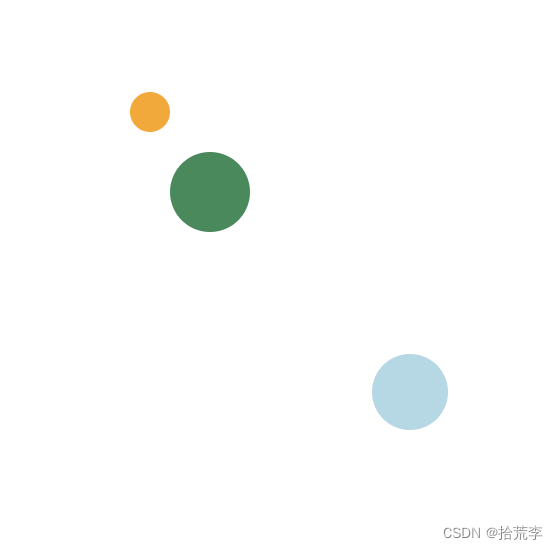
const data = [
{
cx: 100, cy: 100, r: 10, fill: 'orange' },
{
cx: 130, cy: 140, r: 20, fill: 'seagreen' },
{
cx: 230, cy: 240, r: 19, fill: 'lightblue' },
]
d3.select('svg').selectAll('circle')
.data(data)
.enter()
.append('circle')
.attr('cx', d => d.cx)
.attr('cy', d => d.cy)
.attr('r', d => d.r)
.attr('fill', d => d.fill)
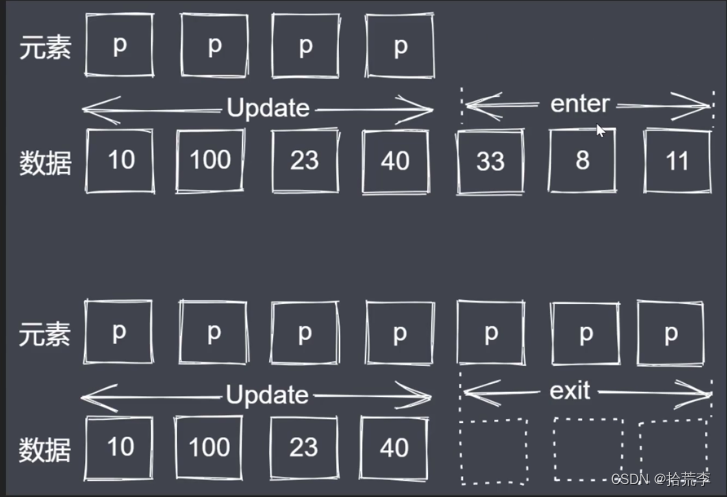
// update enter exit
/**
* update --> 数据和元素相等
* enter --> 数据多于元素
* exit -> 元素多于数据
*/
</script>
</body>
</html>
update-enter-exit
<!DOCTYPE html>
<html lang="en">

<head>
  <meta charset="UTF-8">
  <meta http-equiv="X-UA-Compatible" content="IE=edge">
  <meta name="viewport" content="width=device-width, initial-scale=1.0">
  <title>三种选择集</title>
  <script src="./d3.min.js"></script>
</head>

<body>
  <p></p>
  <p></p>
  <p></p>
  <script>
    // 数据
    // const data = [1, 2, 3, 4, 5]
    // const allAp = d3.selectAll('body p')
    // const update = allAp.data(data)
    // update.text(d => "更新" + d)
    // const enter = update.enter()
    // enter.append('p').text(d => '新增' + d)

    // const allAp = d3.selectAll('body p')
    // const update = allAp.data(data)
    // update.text(d => "更新" + d)

    // const exit = update.exit()
    // exit.text(d => "将要删除" + d)

    // 03 enter
    // d3.select('body').selectAll('p')
    //   .data(data)
    //   .enter()
    //   .append('p')
    //   .text(d => d)

    // 04 data datum
    // const data = [1, 2, 3, 4, 5]
    // const data = '拉勾教育'
    const data = {

       name: 'lg', age: 100 }

    d3.selectAll('body p')
      // .data(data)
      .datum(data)
      .text(d => d.name)
  </script>
</body>

</html>
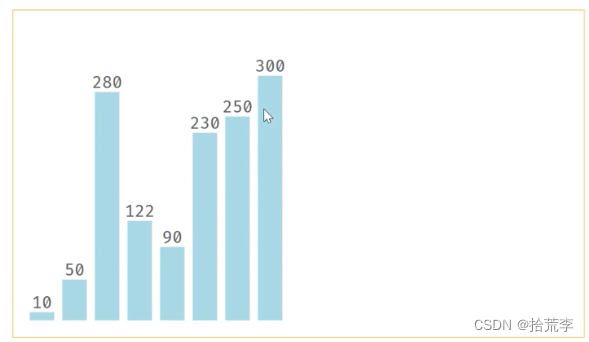
五、绘制静态直方图
<!DOCTYPE html>
<html lang="en">

<head>
  <meta charset="UTF-8">
  <meta http-equiv="X-UA-Compatible" content="IE=edge">
  <meta name="viewport" content="width=device-width, initial-scale=1.0">
  <title>绘制直方图</title>
  <script src="./d3.min.js"></script>
  <style>
    div svg {


      display: block;
      margin: 40px auto 0;
      border: 1px solid orange;
    }
  </style>
</head>

<body>
  <div id="svg"></div>
  <script>
    // 定义数据
    const width = 700
    const height = 400
    const rectStep = 40
    const rectWidth = 30
    const data = [10, 50, 280, 122, 90, 230, 250, 300]

    // 定义填充
    const margin = {

       left: 20, right: 20, top: 20, bottom: 20 }

    // 创建 svg
    d3.select('#svg').append('svg')
      .attr('width', width)
      .attr('height', height)

    // 绘制矩形
    d3.select('svg').selectAll('rect')
      .data(data)
      .enter()
      .append('rect')
      .attr('x', (d, i) => margin.left + i * rectStep)
      .attr('y', d => height - d - margin.bottom)
      .attr('width', rectWidth)
      .attr('height', d => d)
      .attr('fill', 'lightblue')

    // 绘制文字
    d3.select('svg').selectAll('text')
      .data(data)
      .enter()
      .append('text')
      .attr('fill', '#666')
      .attr('font-size', '20')
      .attr('x', (d, i) => margin.left + i * rectStep)
      .attr('y', d => height - d - margin.bottom - 5)
      .attr('text-anchor', 'middle')
      .attr('transform', `translate(${
        rectWidth / 2})`)
      .text(d => d)
  </script>
</body>

</html>
六、线性比例尺
控制数据显示在一定范围。
  // 定义线性比例尺
    const linear = d3.scaleLinear()
      .domain([0, d3.max(data)])
      .range([0, 300])
<!DOCTYPE html>
<html lang="en">

<head>
  <meta charset="UTF-8">
  <meta http-equiv="X-UA-Compatible" content="IE=edge">
  <meta name="viewport" content="width=device-width, initial-scale=1.0">
  <title>绘制直方图</title>
  <script src="./d3.min.js"></script>
  <style>
    div svg {


      display: block;
      margin: 40px auto 0;
      border: 1px solid orange;
    }
  </style>
</head>

<body>
  <div id="svg"></div>
  <script>
    // 定义数据
    const width = 700
    const height = 400
    const rectStep = 40
    const rectWidth = 30
    const data = [10, 50, 180, 122, 90, 230, 250, 300]

    // 定义填充
    const margin = {

       left: 20, right: 20, top: 20, bottom: 20 }

    // 定义线性比例尺
    const linear = d3.scaleLinear()
      .domain([0, d3.max(data)])
      .range([0, 300])

    // 创建 svg
    d3.select('#svg').append('svg')
      .attr('width', width)
      .attr('height', height)

    // 绘制矩形
    d3.select('svg').selectAll('rect')
      .data(data)
      .enter()
      .append('rect')
      .attr('x', (d, i) => margin.left + i * rectStep)
      .attr('y', d => height - linear(d) - margin.bottom)
      .attr('width', rectWidth)
      .attr('height', d => linear(d))
      .attr('fill', 'lightblue')

    // 绘制文字
    d3.select('svg').selectAll('text')
      .data(data)
      .enter()
      .append('text')
      .attr('fill', '#666')
      .attr('font-size', '20')
      .attr('x', (d, i) => margin.left + i * rectStep)
      .attr('y', d => height - d - margin.bottom - 5)
      .attr('text-anchor', 'middle')
      .attr('transform', `translate(${
        rectWidth / 2})`)
      .text(d => d)
  </script>
</body>

</html>
七、D3常见比例尺
<!DOCTYPE html>
<html lang="en">

<head>
  <meta charset="UTF-8">
  <meta http-equiv="X-UA-Compatible" content="IE=edge">
  <meta name="viewport" content="width=device-width, initial-scale=1.0">
  <title>D3常见比例尺</title>
  <script src="./d3.min.js"></script>
</head>

<body>
  <script>
    // 比例尺: 线性  +  序数
    // 01 scaleLinear
    let scale = d3.scaleLinear()
    //   .domain([1, 5])
    //   .range([1, 100])
    // console.log(scale(1))
    // console.log(scale(4))
    // console.log(scale(5))
    // scale.clamp(true)
    // console.log(scale(-1))
    // console.log(scale(10))

    // 02 scaleBand
    scale = d3.scaleBand()
      .domain([1, 2, 3, 4])
      .range([0, 100])
    // console.log(scale(1))
    // console.log(scale(2))
    // console.log(scale(3))
    // console.log(scale(4))
    // console.log(scale(0))
    // console.log(scale(10))

    // 03 scaleOrdinal
    scale = d3.scaleOrdinal()
      .domain(['lg', 'syy', 'zce'])
      .range([18, 22, 40, 50])
    // console.log(scale('lg'))
    // console.log(scale('syy'))
    // console.log(scale('zce'))
    // console.log(scale('abc'))
    // console.log(scale('abcde'))

    // 04 scaleQuantize
    scale = d3.scaleQuantize().domain([0, 10]).range(['xl', 'm', 's'])
    console.log(scale(3.4))
    console.log(scale(4))
    console.log(scale(6.7))
    console.log(scale(-10))
    console.log(scale(30))

  </script>
</body>

</html>
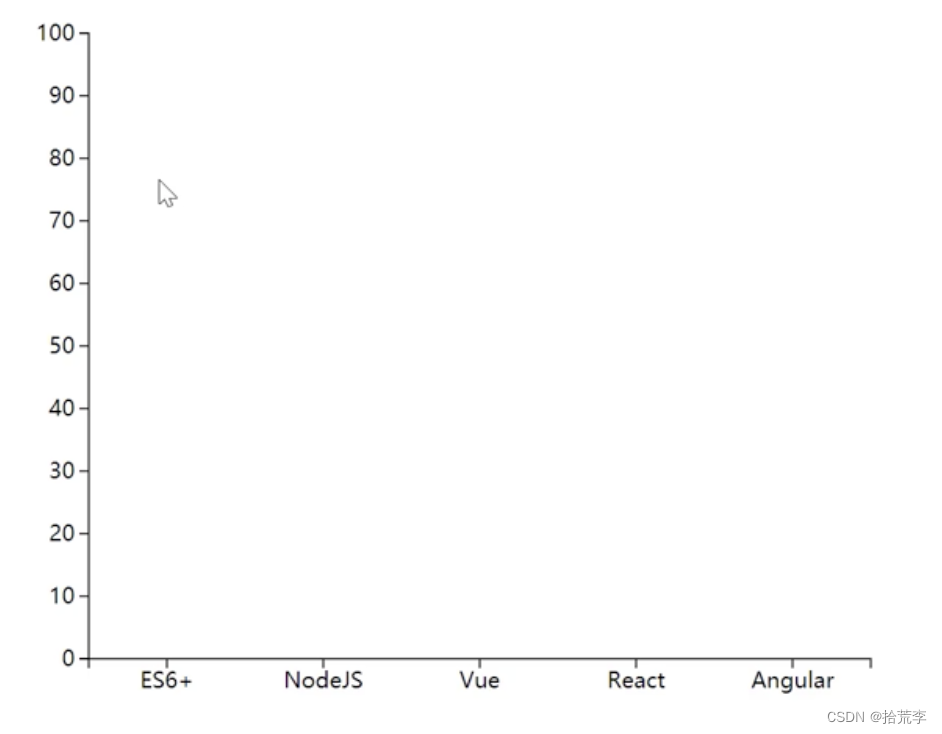
八、比例尺与坐标轴
<!DOCTYPE html>
<html lang="en">

<head>
  <meta charset="UTF-8">
  <meta http-equiv="X-UA-Compatible" content="IE=edge">
  <meta name="viewport" content="width=device-width, initial-scale=1.0">
  <title>比例尺与坐标轴</title>
  <script src="./d3.min.js"></script>
</head>

<body>
  <div id="box"></div>
  <script>
    // 定义数据
    const width = 600
    const height = 500
    const margin = {

       left: 50, right: 50, bottom: 50, top: 50 }
    const kindData = ['ES6+', "NodeJS", "Vue", "React", "Angular"]
    const kindPixel = [margin.left, width - margin.right]
    const ratioData = [80, 60, 50, 20, 100]
    const ratioPixel = [height - margin.bottom, margin.top]

    // 设置画布
    d3.select('#box').append('svg')
      .attr('width', width)
      .attr('height', height)

    // 定义比例尺
    const xScale = d3.scaleBand().domain(kindData).rangeRound(kindPixel)
    // 定义坐标刻度生成器
    const xAxis = d3.axisBottom(xScale)
    // 绘制X轴具体的刻度内容
    d3.select('svg').append('g')
      .call(xAxis)
      .attr('transform', `translate(0, ${
        height - margin.bottom})`)
      .attr('font-size', 14)

    // 定义y轴比例尺
    const yScale = d3.scaleLinear().domain([0, d3.max(ratioData)]).range(ratioPixel)
    const yAxis = d3.axisLeft(yScale)
    d3.select('svg').append('g')
      .call(yAxis)
      .attr('transform', `translate(50, 0)`)
      .attr('font-size', 14)

  </script>
</body>

</html>
九、D3过渡
<!DOCTYPE html>
<html lang="en">

<head>
  <meta charset="UTF-8">
  <meta http-equiv="X-UA-Compatible" content="IE=edge">
  <meta name="viewport" content="width=device-width, initial-scale=1.0">
  <title>D3过渡</title>
  <script src="./d3.min.js"></script>
</head>

<body>
  <script>
    // 添加画布
    const svg = d3.select('body').append('svg')
      .attr('width', 600)
      .attr('height', 400)

    // 绘制图形
    const circle = d3.select('svg').append('circle')
      .attr('cx', 100)
      .attr('cy', 100)
      .attr('r', 20)
      .attr('fill', 'seagreen')

    // transition duration delay ease
    // 初始状态  结束状态
    circle.attr('cx', 100).attr('cy', 100)

    // 结束状态
    circle.transition()
      .duration(3000)
      .delay(1000)
      .ease(d3.easeBounce)
      .attr('cx', 500)
      .attr('cy', 300)
  </script>
</body>

</html>
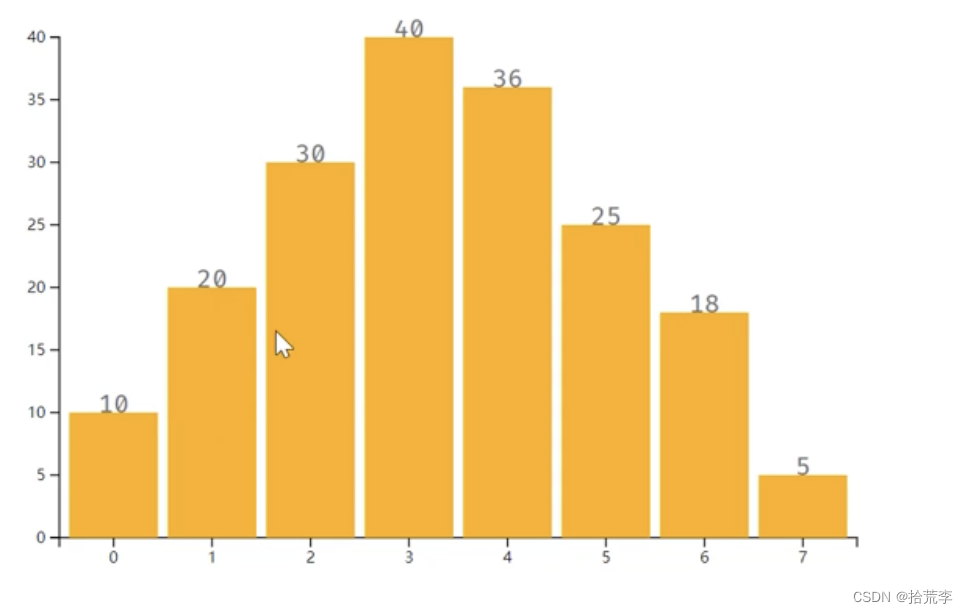
十、过渡直方图1
<!DOCTYPE html>
<html lang="en">

<head>
  <meta charset="UTF-8">
  <meta http-equiv="X-UA-Compatible" content="IE=edge">
  <meta name="viewport" content="width=device-width, initial-scale=1.0">
  <title>柱状图带过渡</title>
  <script src="./d3.min.js"></script>
</head>

<body>
  <script>
    // 画布大小
    const width = 600
    const height = 400

    // 1 添加画布
    const svg = d3.select('body').append('svg')
      .attr('width', width)
      .attr('height', height)

    // 2 填充
    const margin = {

       left: 30, right: 30, top: 20, bottom: 30 }

    // 3 准备源数据
    const data = [10, 20, 30, 40, 36, 25, 18, 5]

    // 4 绘制坐标轴(比例尺)[0, 1 , 2, 3]=>[0, 540]
    const xScale = d3.scaleBand()
      .domain(d3.range(data.length))
      .range([margin.left, width - margin.left - margin.right])
      .padding(0.1)

    // 5 定义X轴的生成器
    const xAxis = d3.axisBottom(xScale)
    // 6 绘制X轴坐标
    const gx = d3.select('svg').append('g')
      .call(xAxis)
      .attr('transform', `translate(0, ${
        height - margin.bottom})`)

    // 7 绘制Y轴(比例尺  生成器 Y绘制)[5, 40] [30, 400]
    const yScale = d3.scaleLinear()
      .domain([0, d3.max(data)])
      .range([height - margin.top - margin.bottom, margin.bottom])
    const yAxis = d3.axisLeft(yScale)
    const gy = d3.select('svg').append('g')
      .call(yAxis)
      .attr('transform', `translate(${
        margin.left}, ${
        margin.top})`)

    // 8 绘制柱状图
    const rects = svg.selectAll('.myRect')
      .data(data)
      .enter()
      .append('rect')
      .attr('class', 'myRect')
      .attr('x', (d, i) => xScale(i))
      .attr('y', d => yScale(d))
      .attr('width', xScale.bandwidth())
      .attr('height', d => yScale(0) - yScale(d))
      .attr('fill', 'orange')
      .attr('transform', `translate(0, ${
        margin.top})`)

    // 提供二个状态
    rects.attr('y', () => yScale(0)).attr('height', 0)
    rects.transition()
      .duration(1000)
      .delay((d, i) => i * 200)
      .ease(d3.easeBounce)
      .attr('y', d => yScale(d))
      .attr('height', d => yScale(0) - yScale(d))

    // 9 绘制文件
    const texts = svg.selectAll('myText')
      .data(data)
      .enter()
      .append('text')
      .attr('class', 'myText')
      .attr('fill', '#666')
      .attr('text-anchor', 'middle')
      .attr('x', (d, i) => xScale(i))
      .text(d => d)
      .attr('transform', `translate(${
        xScale.bandwidth() / 2}, ${
        margin.top})`)
      .attr('y', () => yScale(0))
      .transition()
      .delay((d, i) => i * 200)
      .duration(1000)
      .ease(d3.easeBounce)
      .attr('y', (d) => yScale(d) - 5)
  </script>
</body>

</html>
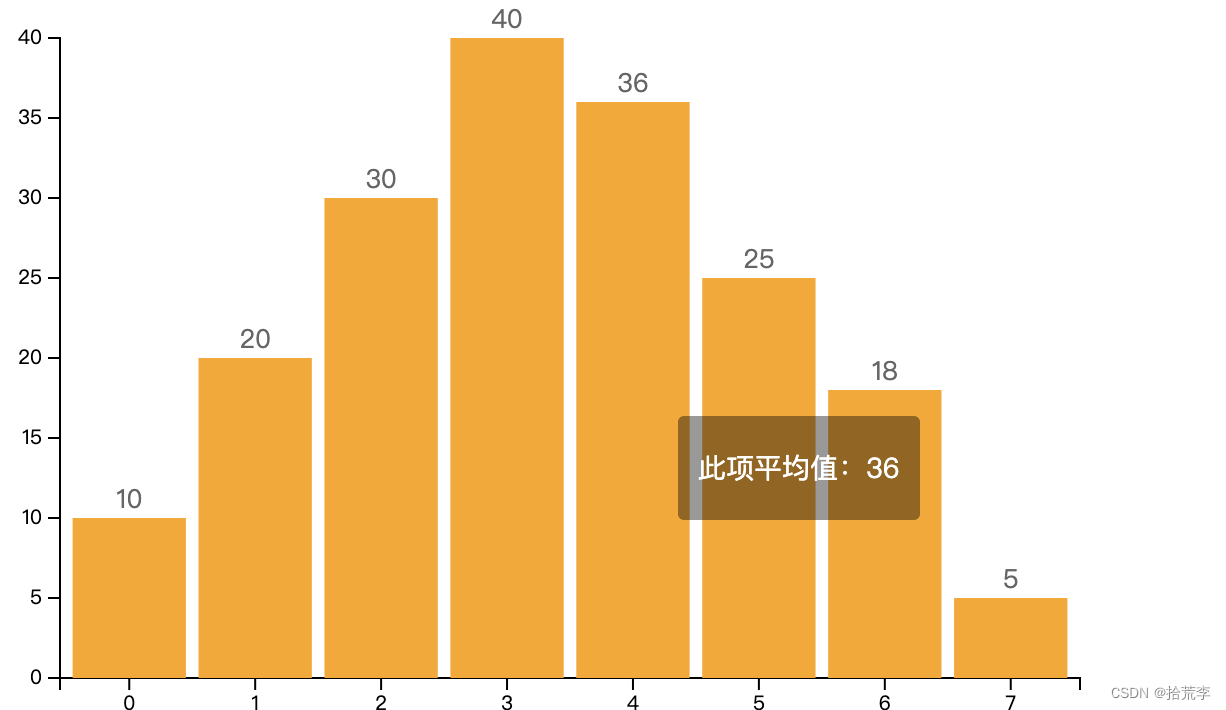
十一、D3交互
<!DOCTYPE html>
<html lang="en">

<head>
  <meta charset="UTF-8">
  <meta http-equiv="X-UA-Compatible" content="IE=edge">
  <meta name="viewport" content="width=device-width, initial-scale=1.0">
  <title>柱状图带交互</title>
  <style>
    html,
    body {


      width: 100%;
      margin: 0;
    }

    #tip {


      color: #fff;
      display: none;
      margin-top: 15px;
      margin-left: 15px;
      position: absolute;
      padding: 5px 10px;
      border-radius: 3px;
      background: rgba(0, 0, 0, .4);
      font: normal 14px/1em '微软雅黑';
    }
  </style>
  <script src="./d3.min.js"></script>
</head>

<body>
  <script>
    // 画布大小
    const width = 600
    const height = 400

    // 1 添加画布
    const svg = d3.select('body').append('svg')
      .attr('width', width)
      .attr('height', height)

    // 2 填充
    const margin = {

       left: 30, right: 30, top: 20, bottom: 30 }

    // 3 准备源数据
    const data = [10, 20, 30, 40, 36, 25, 18, 5]

    // 4 绘制坐标轴(比例尺)[0, 1 , 2, 3]=>[0, 540]
    const xScale = d3.scaleBand()
      .domain(d3.range(data.length))
      .range([margin.left, width - margin.left - margin.right])
      .padding(0.1)

    // 5 定义X轴的生成器
    const xAxis = d3.axisBottom(xScale)
    // 6 绘制X轴坐标
    const gx = d3.select('svg').append('g')
      .call(xAxis)
      .attr('transform', `translate(0, ${
        height - margin.bottom})`)

    // 7 绘制Y轴(比例尺  生成器 Y绘制)[5, 40] [30, 400]
    const yScale = d3.scaleLinear()
      .domain([0, d3.max(data)])
      .range([height - margin.top - margin.bottom, margin.bottom])
    const yAxis = d3.axisLeft(yScale)
    const gy = d3.select('svg').append('g')
      .call(yAxis)
      .attr('transform', `translate(${
        margin.left}, ${
        margin.top})`)

    // 8 绘制柱状图
    const rects = svg.selectAll('.myRect')
      .data(data)
      .enter()
      .append('rect')
      .attr('class', 'myRect')
      .attr('x', (d, i) => xScale(i))
      .attr('y', d => yScale(d))
      .attr('width', xScale.bandwidth())
      .attr('height', d => yScale(0) - yScale(d))
      .attr('fill', 'orange')
      .attr('transform', `translate(0, ${
        margin.top})`)

    // 提供二个状态
    rects.attr('y', () => yScale(0)).attr('height', 0)
    rects.transition()
      .duration(1000)
      .delay((d, i) => i * 200)
      .ease(d3.easeBounce)
      .attr('y', d => yScale(d))
      .attr('height', d => yScale(0) - yScale(d))

    // 9 绘制文件
    const texts = svg.selectAll('myText')
      .data(data)
      .enter()
      .append('text')
      .attr('class', 'myText')
      .attr('fill', '#666')
      .attr('text-anchor', 'middle')
      .attr('x', (d, i) => xScale(i))
      .text(d => d)
      .attr('transform', `translate(${
        xScale.bandwidth() / 2}, ${
        margin.top})`)
      .attr('y', () => yScale(0))
      .transition()
      .delay((d, i) => i * 200)
      .duration(1000)
      .ease(d3.easeBounce)
      .attr('y', (d) => yScale(d) - 5)

    // 自定义缓动类
    class EaseObj {


      constructor(target) {


        this.target = target
        this.pos = {

       x: width / 2, y: height / 2 }
        this.endPos = {

       x: 0, y: 0 }
        this._play = false
        this.fm = 0
        this.speed = 0.1
      }
      set animate(value) {


        if (value !== this._play) {


          if (value) {


            this.render()
          } else {


            this.cancel()
          }
          this._play = value
        }
      }

      render() {


        const {

       pos, endPos, speed, target } = this
        pos.x += (endPos.x - pos.x) * speed
        pos.y += (endPos.y - pos.y) * speed
        target.style('left', `${
        pos.x}px`)
          .style('top', `${
        pos.y}px`)

        this.fm = requestAnimationFrame(() => {


          this.render()
        })
      }

      cancel() {


        cancelAnimationFrame(this.fm)
      }
    }

    // 10 定义提示框元素
    const tip = d3.select('body').append('div').attr('id', 'tip')
    // 11 鼠标移上
    rects.on('mouseover', ({

        clientX, clientY }, data) => {


      tip.style('left', `${
        clientX}px`)
        .style('top', `${
        clientY}px`)
        .style('display', 'block')
        .html(`
          <p>此项平均值:${
        data}</p>
        `)
    })

    const tipObj = new EaseObj(tip)
    rects.on('mousemove', ({

        clientX, clientY }, data) => {


      tipObj.endPos = {

       x: clientX, y: clientY }
      tipObj.animate = true
    })

    rects.on('mouseout', () => {


      tipObj.animate = false
      tip.style('display', 'none')
    })


    // rects.on('mousemove', ({ clientX, clientY }, data) => {


    //   tip.style('left', `${clientX}px`)
    //     .style('top', `${clientY}px`)
    // })

    // rects.on('mouseout', ({ clientX, clientY }, data) => {


    //   tip.style('left', `${clientX}px`)
    //     .style('top', `${clientY}px`)
    //     .style('display', 'none')
    // })
  </script>
</body>

</html>
