1、安装Debug Diagnostic Tool.exe,自行到微软官方链接中下载。
2、运行需要测试的程序UnitTest.exe。
3、打开DebugDiag1.2,选择 ”Native (non-.Net) Memory and Handle Leak” ,然后next。
4、选中UnitTest.exe进程,next。
5、保持default选择,next。
6、生成Leak Rules,保持default选择,next。
7、保持”Active the rule now”选择,Finish。
8、Tools -> Options And Settings
(1) Folders and Search Paths: 添加Symbols文件: SRV*D:\symbol*http://msdl.microsoft.com/download/symbols;D:\xxx-YourProjectPdbFilePath.
Dump文件保存路径保持不变。
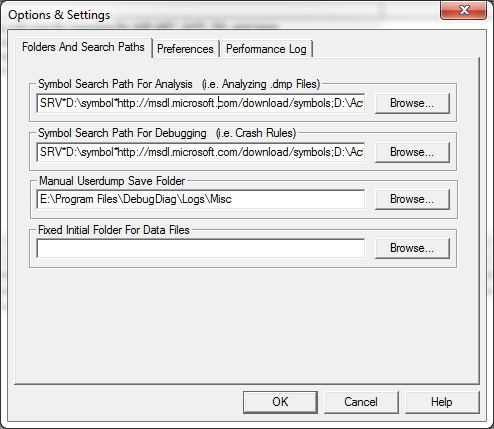
(2) Preferences: 勾选”检测内存泄露时立即记录调用栈信息”,当测试时间>15mins时不建议勾选。

9、运行UnitTest程序,为了产生较多的泄露,可以多运行几次.
10、Rules选项卡中,右键点击Leak Rule -> Dump Target Process(es) -> Create Full Userdump(s).从而生成dump文件,位置在E:\Program File