1、Check system overall memory
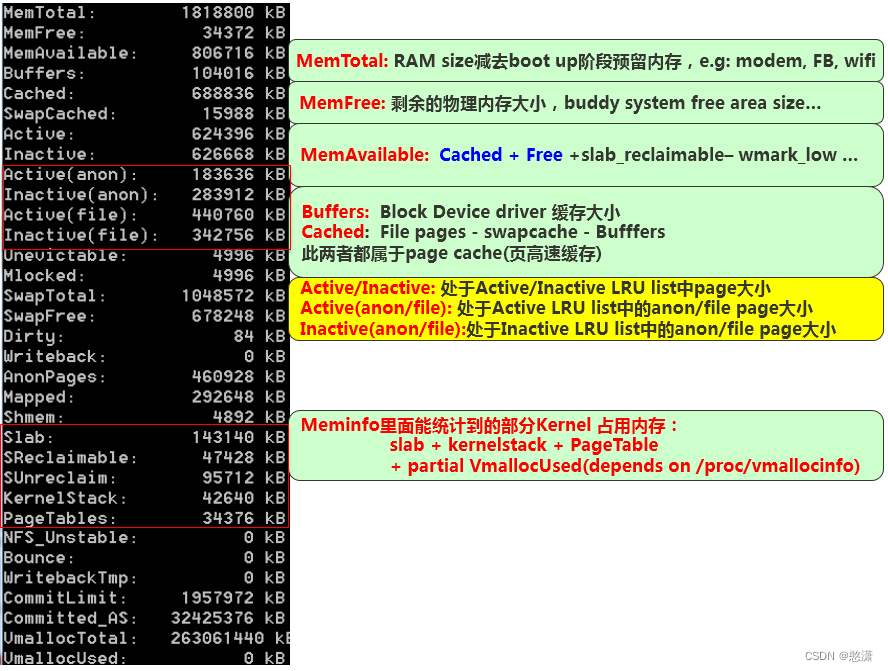
1-1 adb shell cat /proc/meminfo
1-2 adb shell dumpsys meminfo
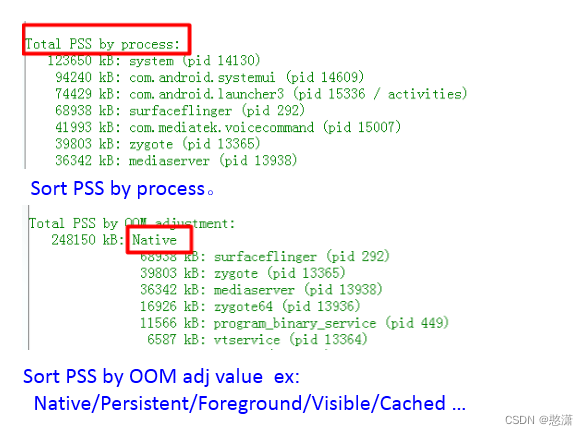
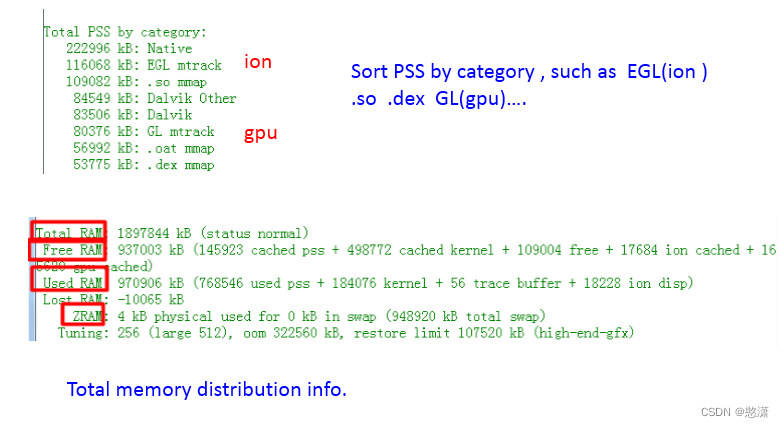
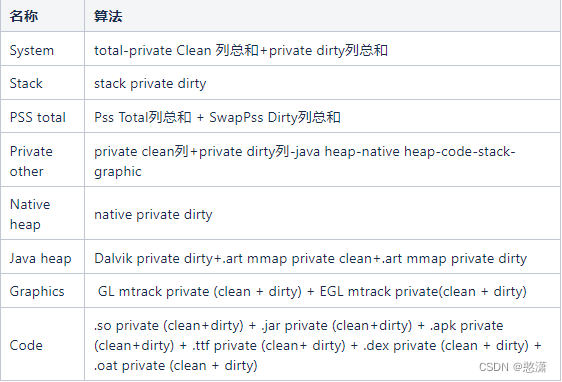
Total memory distribution info
total PSS = cached pss + used pss (cached pss : adj >=900 process pss sum , used pss : adj <900 process pss sum)
total kernel = cached kernel + kernel
cached kernel : slab reclaimable + buffers + cached - mapped
kernel : slab unreclaimable + shmem + vmalloc + page tables + kernel stack
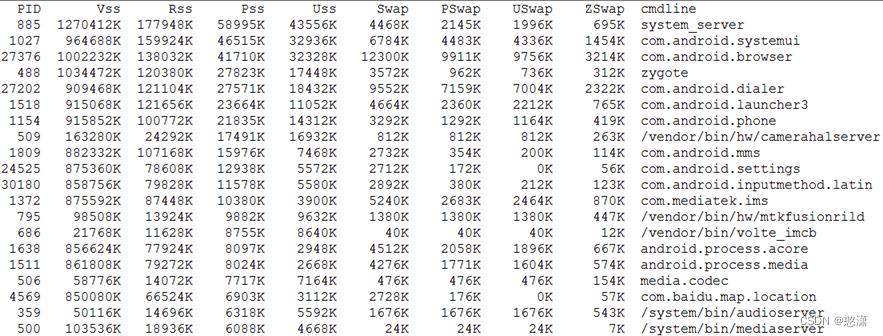
1-3 adb shell procrank
2 Check single process memory
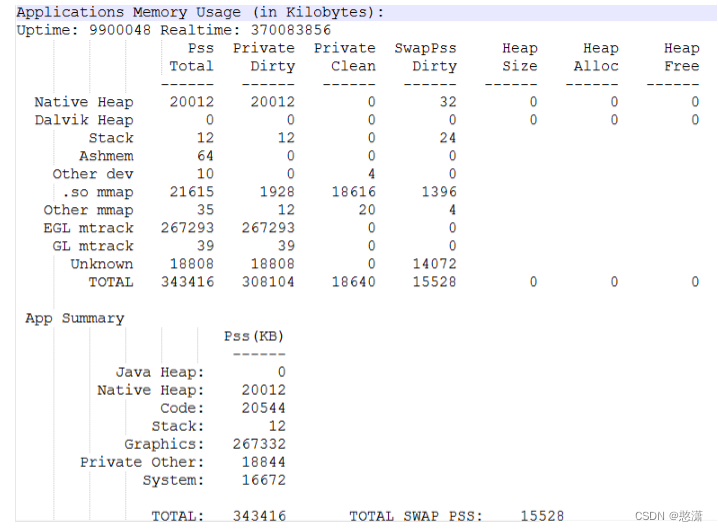
2-1 adb shell dumpsys meminfo $pid
Java heap:
抓取hprof排查heap分布
Native heap:
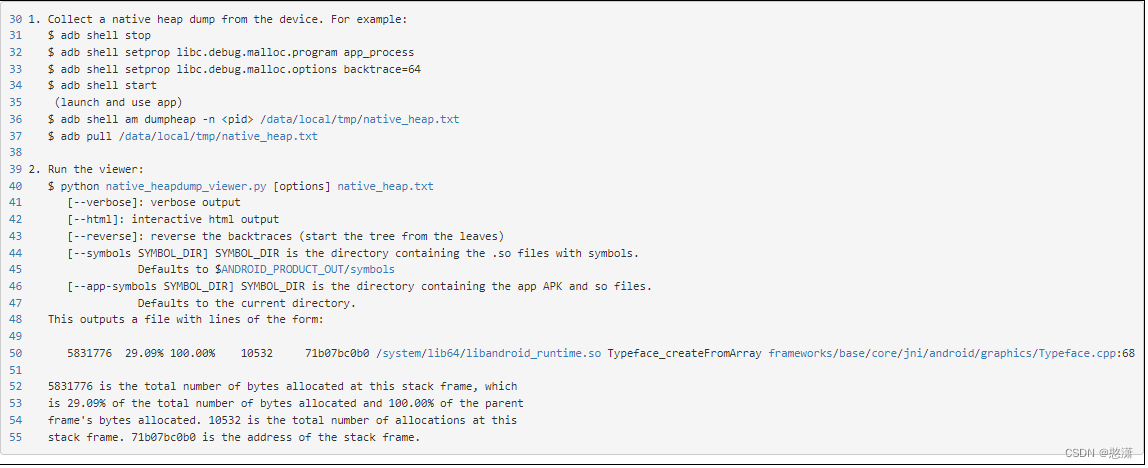
使用malloc debug + adb shell am dumpheap $pid查看
2-2 adb shell system/bin/showmap $ pid
list memory detail of a process ,the data was collected from smaps
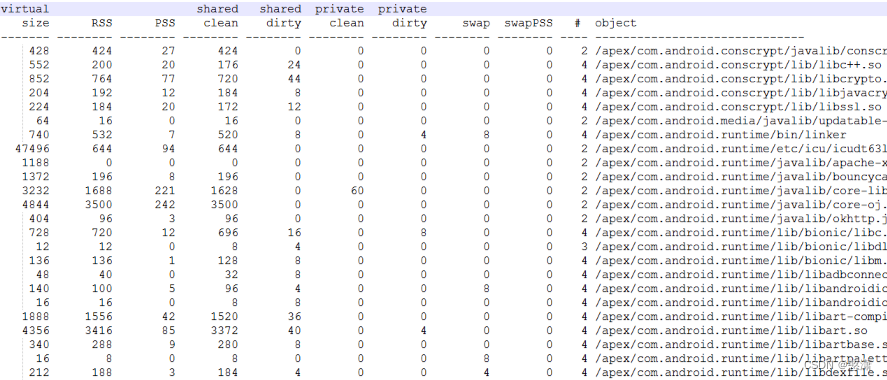
2-3 adb shell cat /proc/$pid/smaps
list memory detail of a process
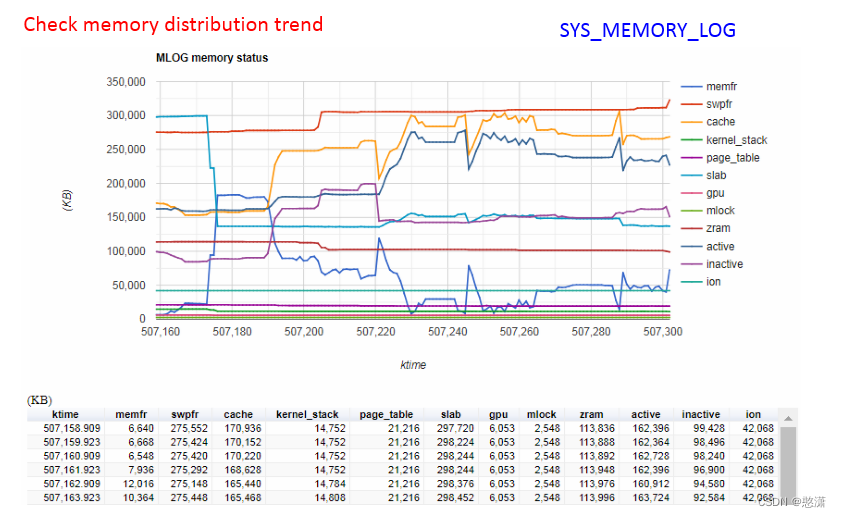
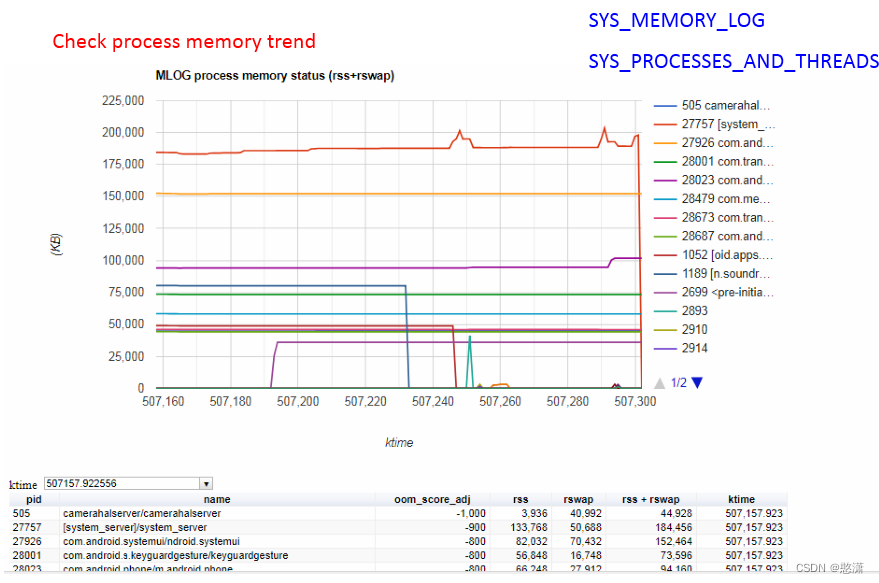
3 Memory tracking by mlog
3-1 how to get mlog
/d/mlog : cat /d/mlog will update periodically(1s)
/d/dmlog : the last mlog (about last ~30s mlog)(it is also SYS_MEMORY_LOG in SWT/ANR/NE db)
3-2 mlog format
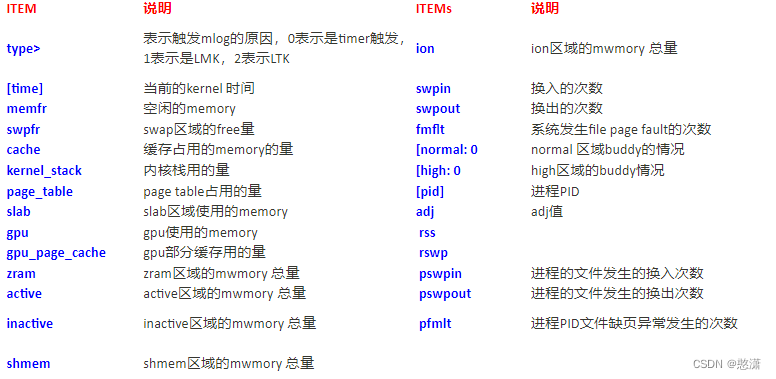
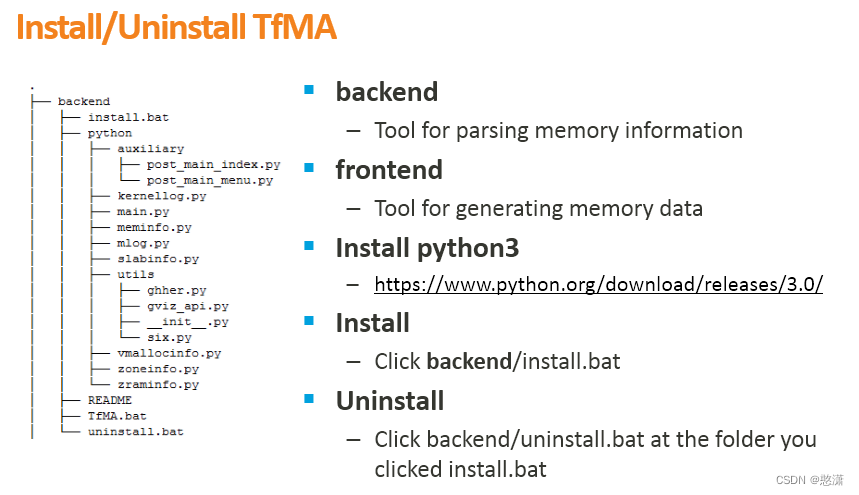
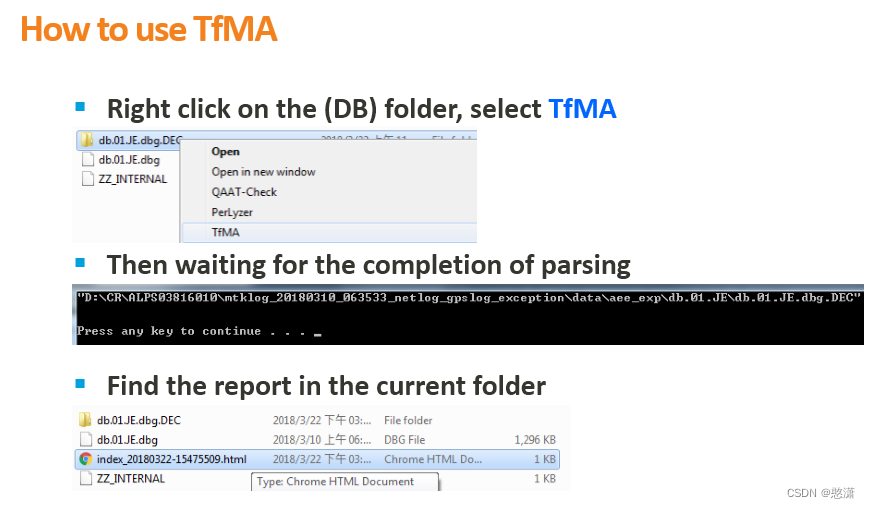
3-3 use TfMA tool to parsing mlog (get this tool from submit e-service request)