报告说有cdb mysql实例最近很慢,写入速度巨慢,而且是间歇性的有的时候每隔7到8分钟就卡一会,有的时候每隔12分钟就卡一会,问他们是否有定时任务在拉数据?他们说没有。
那是否有很多比较慢的sql把io资源消耗光了呢,去看慢查询记录,结果发现一条select都没有,反而是有很多insert语句,见鬼啦,这咋回事呢?
慢查询有很多记录,如下所示,insert on duplicate key update,粗粗一看,肯定是on duplicate key update的问题,如下:
# User@Host: hsh_ext[hsh_ext] @  [devtest.yikan.com]  Id: 37459
# Query_time: 1.170256  Lock_time: 0.000118 Rows_sent: 0  Rows_examined: 0
SET timestamp=1504065495;
/*id:57539043*/insert into hy_deive(record_time, platform, device_id,
    install_id, device_token, push_enabled,
    `uid`, model, app_version, is_login, device_type, created_at,
    updated_at)
    values

      (
      1504065494, 'android', '863049030002995',
      '417e03c9-b879-4741-86b6-beb8c1f42497', 'Anj6kMy77g-2sKlb7idPuxAQ58eXdE_JILDvT-xITBfb', 0,
      4234883169, 'OPPO', '3.36.2', 1, 'umeng',
      1504065494, 1504065494
      )
     ,
      (
      1504065494, 'android', '863049030002995',
      '417e03c9-b879-4741-86b6-beb8c1f42497', 'F5nrlikA1gCLSrLZ7Xby1ASn+fXqSJZ3xATxvkJtXzU=', 0,
      4234883169, 'OPPO', '3.36.2', 1, 'xiaomi',
      1504065494, 1504065494
      )
     ,
      (
      1504065494, 'android', '863049030002995',
      '417e03c9-b879-4741-86b6-beb8c1f42497', '0863049030002995200000184200CN01', 0,
      4234883169, 'OPPO', '3.36.2', 1, 'huawei',
      1504065494, 1504065494
      )

    on duplicate key update
    record_time = IF(record_time > values(record_time), record_time, values(record_time)),
    platform = IF(record_time > values(record_time), platform, values(platform)),
    install_id = IF(record_time > values(record_time), install_id, values(install_id)),
    device_token = IF(record_time > values(record_time), device_token, values(device_token)),
    push_enabled = IF(record_time > values(record_time), push_enabled, values(push_enabled)),
    model = IF(record_time > values(record_time), model, values(model)),
    app_version = IF(record_time > values(record_time), app_version, values(app_version)),
    is_login = IF(record_time > values(record_time), is_login, values(is_login)),
updated_at = IF(record_time > values(record_time), updated_at, values(updated_at));- 1
- 2
- 3
- 4
- 5
- 6
- 7
- 8
- 9
- 10
- 11
- 12
- 13
- 14
- 15
- 16
- 17
- 18
- 19
- 20
- 21
- 22
- 23
- 24
- 25
- 26
- 27
- 28
- 29
- 30
- 31
- 32
- 33
- 34
- 35
- 36
- 37
- 38
- 39
- 40
但是实际上,准备2条无用的insert into … values… on duplicate key update …..,很快就执行完了,不到0.01s,那为啥那个时候,还有那么多的慢查询记录呢?
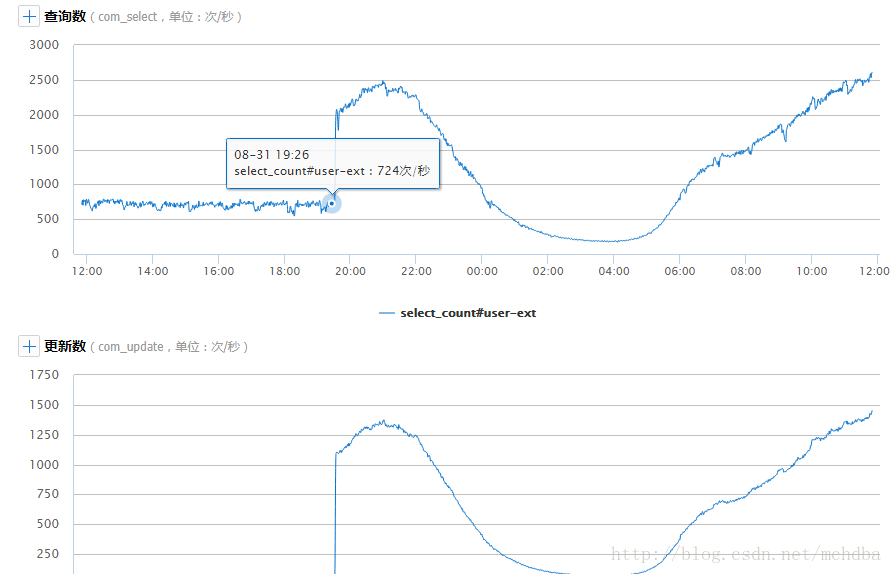
去查看了cdb的监控记录,select、udpate、insert没有啥间隙性的尖刀出现,虽然有起伏有上升空间,但是都比较平稳,没有尖刀,大家看下面的图L

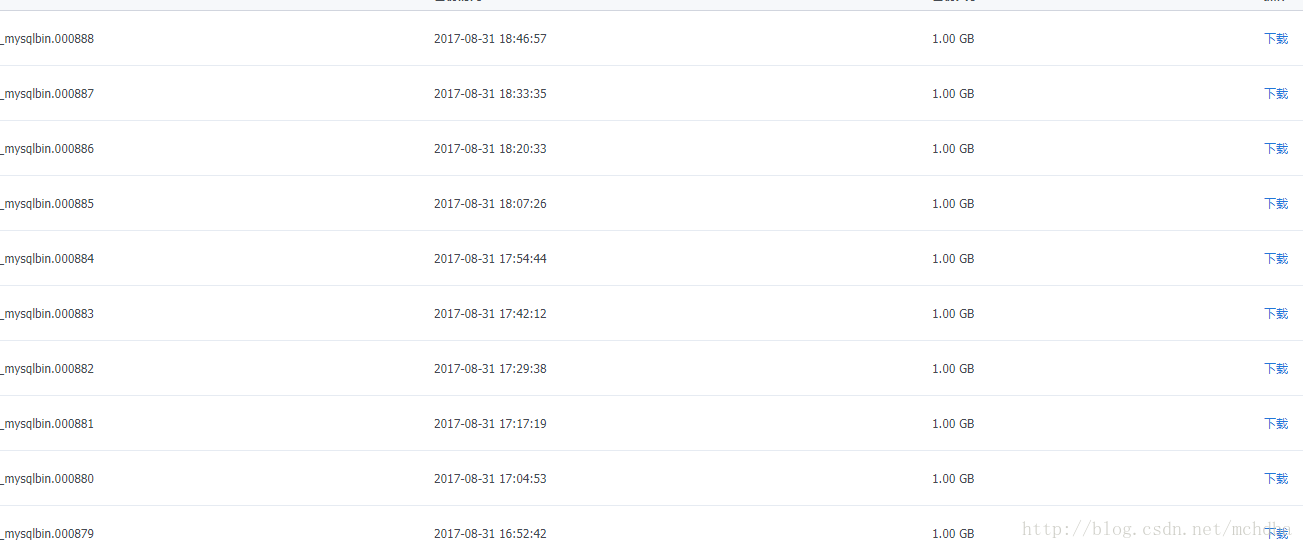
想到既然是insert语句,那么就去看binlog日志吧,看下所有的binlog日志,看看那个卡的时间点,到底都执行了些啥操作呢?
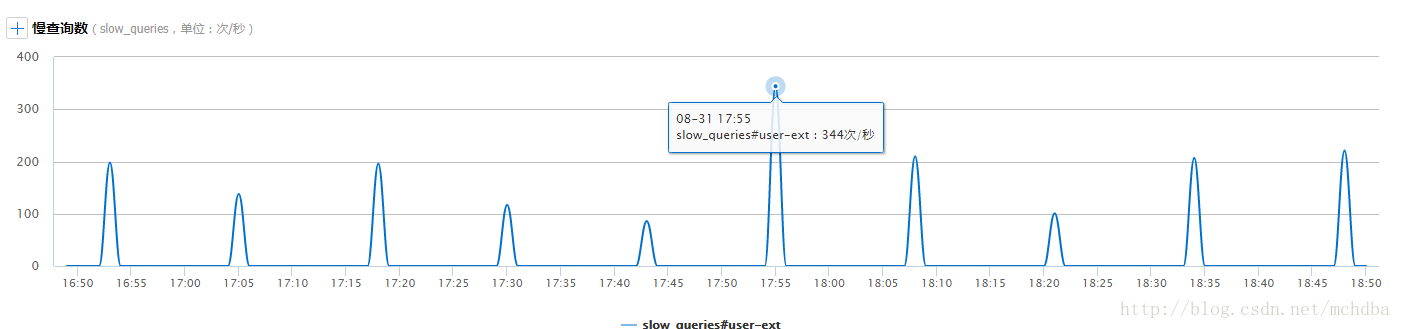
结果一看binlog列表,发现binlog每隔8分钟就会flush下,而这个flush的时间和慢查询的时间正好吻合。
binlog日志生成时间:
慢查询记录时间:
OK,那么问题很明显了,binlog日志太大,flush的时候导致binlog写入时间变慢,因为要写入新的binlog,需要时间。解决方案就是调整binlog最大值,将1G降低到128M。
mysql> show variables like 'max_binlog_size';
+-----------------+------------+
| Variable_name   | Value      |
+-----------------+------------+
| max_binlog_size | 1073741824 |
+-----------------+------------+
1 row in set (0.01 sec)

mysql> select 128*1024*1024;
+---------------+
| 128*1024*1024 |
+---------------+
|     134217728 |
+---------------+
1 row in set (0.01 sec)

mysql> set global max_binlog_size=134217728;
Query OK, 0 rows affected (0.00 sec)

mysql> show variables like 'max_binlog_size';
+-----------------+-----------+
| Variable_name   | Value     |
+-----------------+-----------+
| max_binlog_size | 134217728 |
+-----------------+-----------+
1 row in set (0.00 sec)

mysql> - 1
- 2
- 3
- 4
- 5
- 6
- 7
- 8
- 9
- 10
- 11
- 12
- 13
- 14
- 15
- 16
- 17
- 18
- 19
- 20
- 21
- 22
- 23
- 24
- 25
- 26
- 27
- 28
之后观察了3个小时,再也没有比较慢的insert语句了,而且开发那么反应这段时间也基本没有卡顿的现象了,事情暂时解决了,告一段落啦。
反思,互联网场景中,max_binlog_size值确实不宜过大,这点需要谨记。
问题扩展:
查看当前正在使用的binlog缓存情况:

MySQL:(none) 13:07:41> show global status like 'bin%';
+----------------------------+-----------+
| Variable_name              | Value     |
+----------------------------+-----------+
| Binlog_cache_disk_use      | 1335001   |
| Binlog_cache_use           | 264238120 |
| Binlog_stmt_cache_disk_use | 0         |
| Binlog_stmt_cache_use      | 33        |
+----------------------------+-----------+
4 rows in set (0.00 sec)

MySQL:(none) 13:07:46> show global status like 'bin%';
+----------------------------+-----------+
| Variable_name              | Value     |
+----------------------------+-----------+
| Binlog_cache_disk_use      | 1335006   |
| Binlog_cache_use           | 264240359 |
| Binlog_stmt_cache_disk_use | 0         |
| Binlog_stmt_cache_use      | 33        |
+----------------------------+-----------+
4 rows in set (0.00 sec)

MySQL:(none) 13:07:47>
MySQL:(none) 13:07:48> show global status like 'bin%';
+----------------------------+-----------+
| Variable_name              | Value     |
+----------------------------+-----------+
| Binlog_cache_disk_use      | 1335428   |
| Binlog_cache_use           | 264437761 |
| Binlog_stmt_cache_disk_use | 0         |
| Binlog_stmt_cache_use      | 33        |
+----------------------------+-----------+
4 rows in set (0.00 sec)

MySQL:(none) 13:09:28>- 1
- 2
- 3
- 4
- 5
- 6
- 7
- 8
- 9
- 10
- 11
- 12
- 13
- 14
- 15
- 16
- 17
- 18
- 19
- 20
- 21
- 22
- 23
- 24
- 25
- 26
- 27
- 28
- 29
- 30
- 31
- 32
- 33
- 34
- 35
查看binlog的cache设置:
MySQL:(none) 13:10:58> show variables like '%binlog_cache%';
+-----------------------+----------------------+
| Variable_name         | Value                |
+-----------------------+----------------------+
| binlog_cache_size     | 32768                |
| max_binlog_cache_size | 18446744073709547520 |
+-----------------------+----------------------+
2 rows in set (0.00 sec)

MySQL:(none) 13:11:13> - 1
- 2
- 3
- 4
- 5
- 6
- 7
- 8
- 9
- 10
binlog_cache_size:
为每个session 分配的内存,在事务过程中用来存储二进制日志的缓存。binlog_cache_disk_use表示因为我们binlog_cache_size设计的内存不足导致缓存二进制日志用到了临时文件的次数;binlog_cache_use表示 用binlog_cache_size缓存的次数;当对应的Binlog_cache_disk_use 值比较大的时候而且Binlog_cache_use也比较大的时候,我们可以考虑适当的调高 binlog_cache_size 对应的值
进一步分析:
我们这里可以看到Binlog_cache_disk_use已经是1.27M,而且Binlog_cache_use值为264437761表示已经执行了2亿多次了,而且这2个值一直在变大,就表名,binlog_cache_size远远不够用,所以这里就可以提高binlog_cache_size的值了。
MySQL:(none) 13:40:08> set global binlog_cache_size=8388608;
Query OK, 0 rows affected (0.00 sec)

MySQL:(none) 13:40:22> - 1
- 2
- 3
- 4
引申下max_binlog_cache_size:
max_binlog_cache_size 表示的是binlog 能够使用的最大cache 内存大小,当我们执行多语句事务的时候 所有session的使用的内存超过max_binlog_cache_size的值时,就会报错:“Multi-statement transaction required more than ‘max_binlog_cache_size’ bytes ofstorage”,设置太大的话,会比较消耗内存资源;设置太小又会使用到临时文件即disk