echarts饼图中间有间隔

var chartPieState = echarts.init(document.getElementById('chartPieState'));
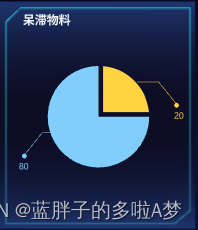
在这里插入图片描述
在需要间隔的部分 加一个 selected:true 即可

option = {


  tooltip: {
    
    
    trigger: 'item'
  },
  legend: {
    
    
    orient: 'vertical',
    left: 'left'
  },
  series: [
    {
    
    
      type: 'pie',
      radius: '50%',
            label: {
    
    
                normal: {
    
    
                    position: 'inner',
                    show: true,
                    formatter: '{b}: {d}%'
                }
            },
            labelLine: {
    
    
                normal: {
    
    
                    show: true
                }
            },
      data: [
        {
    
     value: 1048, name: '7-10天',selected:true },
        {
    
     value: 735, name: '超过30天' },
      ],
    }
  ]
};

猜你喜欢

转载自blog.csdn.net/Maxueyingying/article/details/130154103