1 (推荐)添加ECharts5代码利用Vue3.2版本之后提供的<script setup>语法
单文件组件<script setup>语法参考
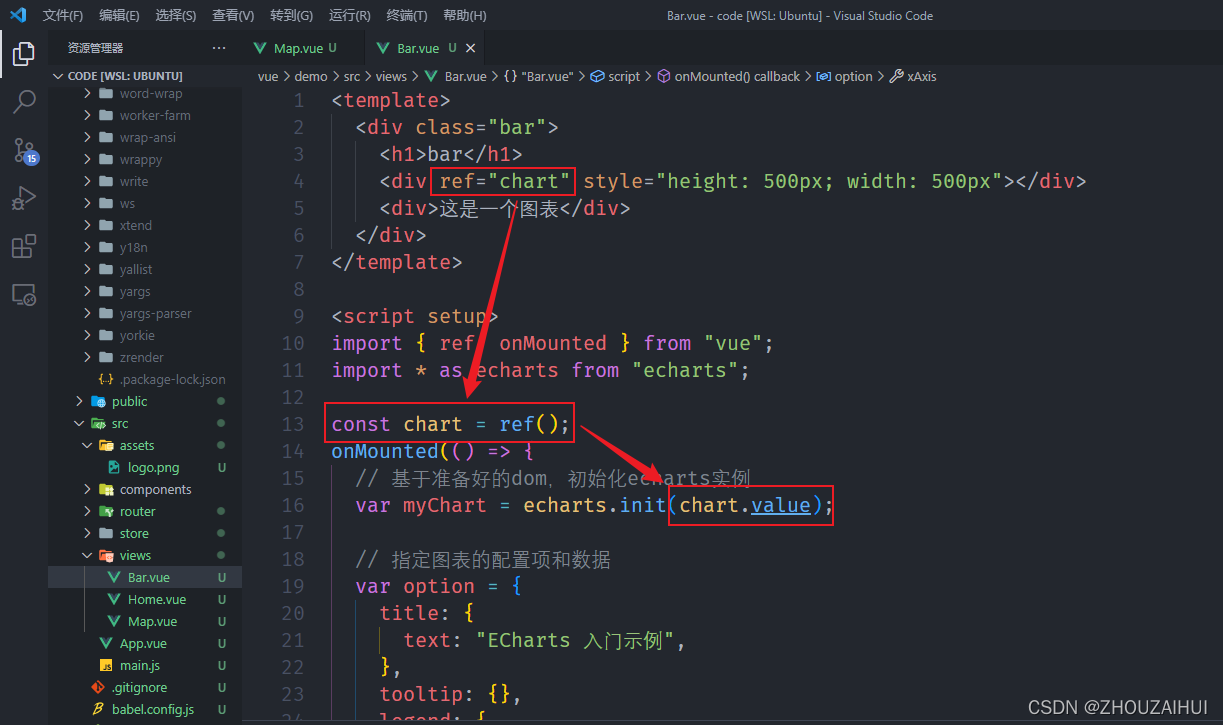
(1)第一种写法
<template>
<div class="bar">
<h1>bar</h1>
<div ref="chart" style="height: 500px; width: 500px"></div>
<div>这是一个图表</div>
</div>
</template>
<script setup>
import {
ref, onMounted } from "vue";
import * as echarts from "echarts";
const chart = ref();
onMounted(() => {
var myChart = echarts.init(chart.value);
var option = {
title: {
text: "ECharts 入门示例",
},
tooltip: {
},
legend: {
data: ["销量"],
},
xAxis: {
data: ["衬衫", "羊毛衫", "雪纺衫", "裤子", "高跟鞋", "袜子"],
},
yAxis: {
},
series: [
{
name: "销量",
type: "bar",
data: [5, 20, 36, 10, 10, 20],
},
],
};
myChart.setOption(option);
});
</script>
<style>
</style>;
(2)第二种写法
<template>
<div class="bar">
<h1>bar</h1>
<div ref="chart" style="height: 500px; width: 500px"></div>
<div>这是一个图表</div>
</div>
</template>
<script setup>
import {
ref, onMounted } from "vue";
import * as echarts from "echarts";
const chart = ref();
var option = {
title: {
text: "ECharts 入门示例",
},
tooltip: {
},
legend: {
data: ["销量"],
},
xAxis: {
data: ["衬衫", "羊毛衫", "雪纺衫", "裤子", "高跟鞋", "袜子"],
},
yAxis: {
},
series: [
{
name: "销量",
type: "bar",
data: [5, 20, 36, 10, 10, 20],
},
],
};
onMounted(() => {
var myChart = echarts.init(chart.value);
myChart.setOption(option);
});
</script>
<style>
</style>;
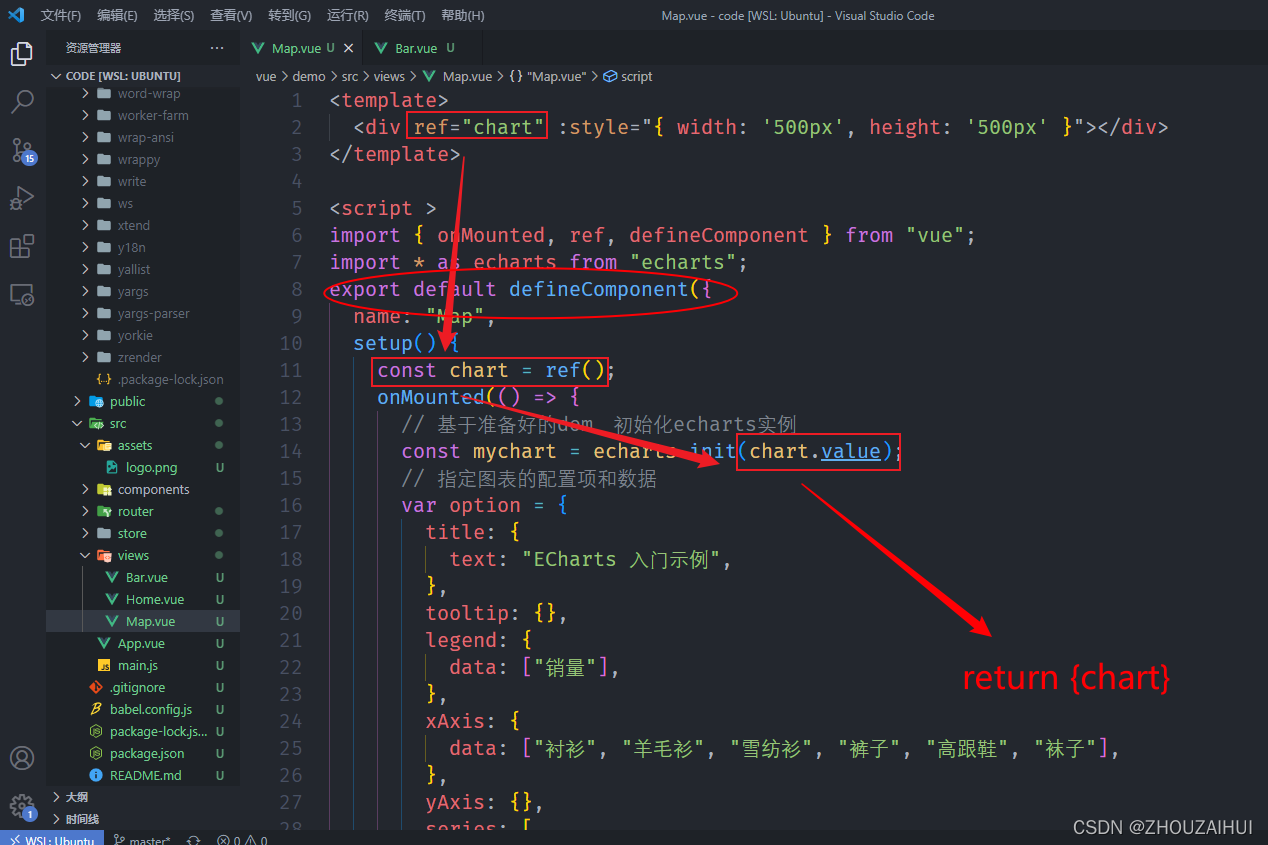
2 添加ECharts5代码利用Vue3版本提供的setup语法(defineComponent语法)
(1)第一种写法
<template>
<div ref="chart" :style="{ width: '500px', height: '500px' }"></div>
</template>
<script >
import {
onMounted, ref, defineComponent } from "vue";
import * as echarts from "echarts";
export default defineComponent({
name: "Map",
setup() {
const chart = ref();
onMounted(() => {
const mychart = echarts.init(chart.value);
var option = {
title: {
text: "ECharts 入门示例",
},
tooltip: {
},
legend: {
data: ["销量"],
},
xAxis: {
data: ["衬衫", "羊毛衫", "雪纺衫", "裤子", "高跟鞋", "袜子"],
},
yAxis: {
},
series: [
{
name: "销量",
type: "bar",
data: [5, 20, 36, 10, 10, 20],
},
],
};
mychart.setOption(option);
});
return {
chart };
},
});
</script>
(2)第2种写法
<template>
<div ref="chart" :style="{ width: '500px', height: '500px' }"></div>
</template>
<script >
import {
onMounted, ref, defineComponent } from "vue";
import * as echarts from "echarts";
export default defineComponent({
name: "Map",
setup() {
const chart = ref();
var option = {
title: {
text: "ECharts 入门示例",
},
tooltip: {
},
legend: {
data: ["销量"],
},
xAxis: {
data: ["衬衫", "羊毛衫", "雪纺衫", "裤子", "高跟鞋", "袜子"],
},
yAxis: {
},
series: [
{
name: "销量",
type: "bar",
data: [5, 20, 36, 10, 10, 20],
},
],
};
onMounted(() => {
const mychart = echarts.init(chart.value);
mychart.setOption(option);
});
return {
chart };
},
});
</script>
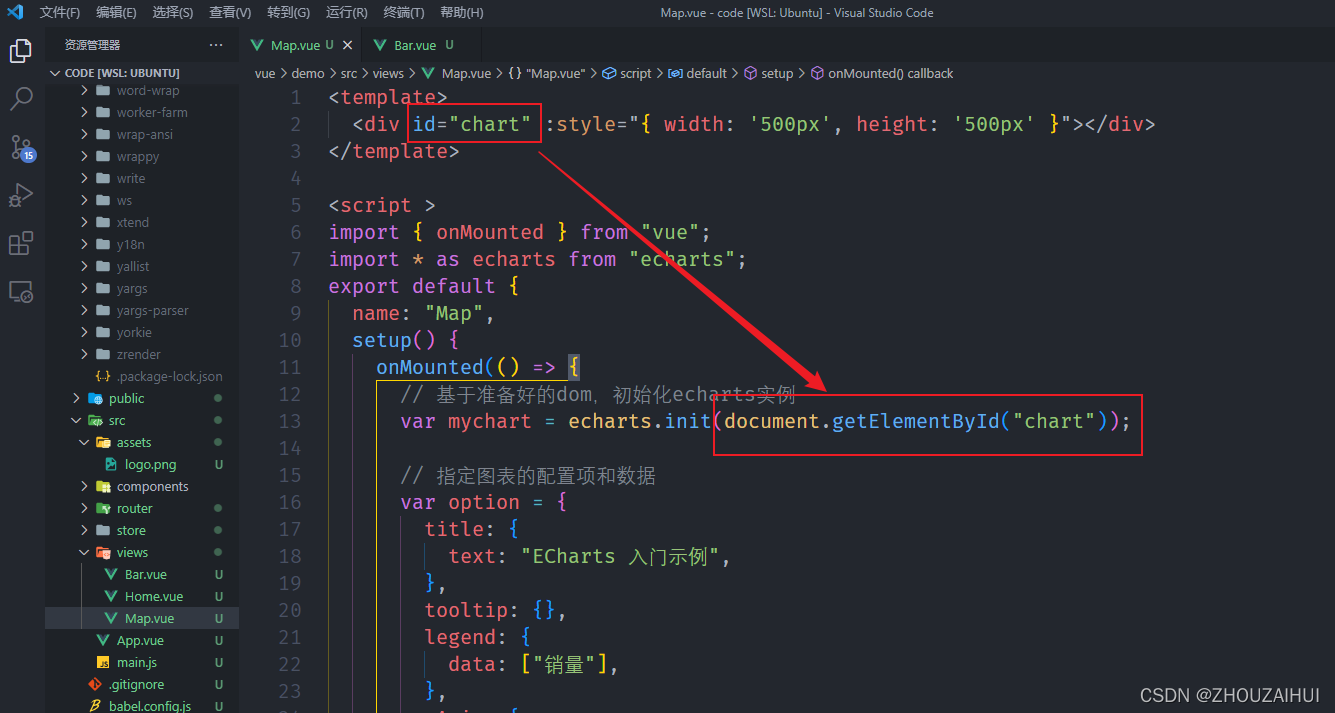
3 添加ECharts5代码利用Vue3版本提供的setup语法(javascript原生选择器)
<template>
<div id="chart" :style="{ width: '500px', height: '500px' }"></div>
</template>
<script >
import {
onMounted } from "vue";
import * as echarts from "echarts";
export default {
name: "Map",
setup() {
onMounted(() => {
var mychart = echarts.init(document.getElementById("chart"));
var option = {
title: {
text: "ECharts 入门示例",
},
tooltip: {
},
legend: {
data: ["销量"],
},
xAxis: {
data: ["衬衫", "羊毛衫", "雪纺衫", "裤子", "高跟鞋", "袜子"],
},
yAxis: {
},
series: [
{
name: "销量",
type: "bar",
data: [5, 20, 36, 10, 10, 20],
},
],
};
mychart.setOption(option);
});
},
};
</script>