效果图: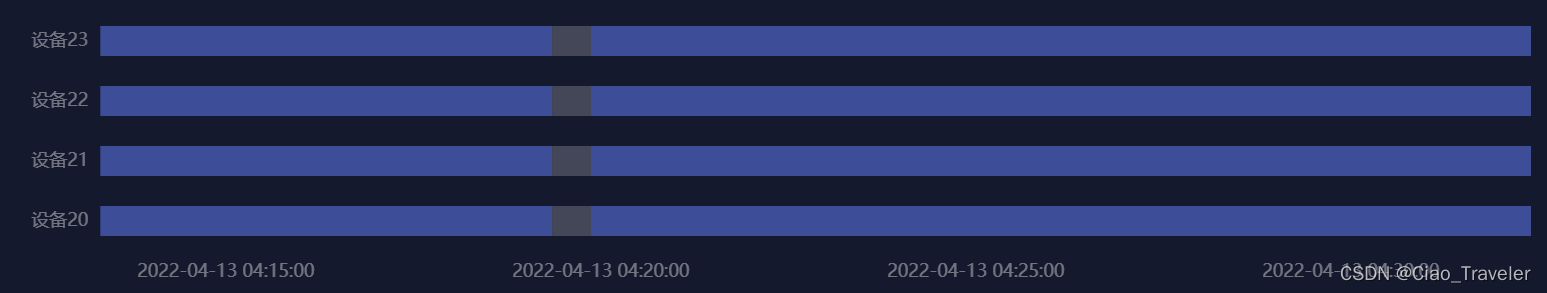
option配置
function renderItem(params: any, api: any) {


    const categoryIndex = api.value(0);
    const start = api.coord([api.value(1), categoryIndex]);
    const end = api.coord([api.value(2), categoryIndex]);
    const height = api.size([0, 1])[1];
    const rectShape = echarts.graphic.clipRectByRect(
      {


        x: start[0],
        y: start[1] - height / 4,
        width: end[0] - start[0],
        height: height / 2
      },
      {


        x: params.coordSys.x,
        y: params.coordSys.y,
        width: params.coordSys.width,
        height: params.coordSys.height
      }
    );
    return (
      rectShape && {


        type: 'rect',
        transition: ['shape'],
        shape: rectShape,
        style: api.style()
      }
    );
  }
  const option: Partial<EChartOption> = {


    backgroundColor: '#15192D ',
    tooltip: {


      backgroundColor: 'rgba(19,26,60,0.85)',
      borderColor: 'rgba(89,112,221,0.45)',
      formatter: function (params: any) {


        // console.log(params);
        return moment(params.value[1]).format('YYYY-MM-DD hh:mm:ss') + ' -  ' + moment(params.value[2]).format('YYYY-MM-DD hh:mm:ss') + '<br/>' + params.name
      },
      textStyle: {


        color: 'rgba(255,255,255,0.85)',
      },
    },
    title: {


      text: 'Profile',
      left: 'center',
      show: false
    },
    grid: {


      height: '80%',
      top: '5%',
      bottom: '5%',
      right: '0%',
      left: '5%'
    },
    xAxis: {


      type: 'time',
      axisLabel: {


        formatter: function (val: any) {


          return moment(val).format('YYYY-MM-DD hh:mm:ss');
        },
        color: 'rgba(255,255,255,0.4)',
        fontFamily: 'MicrosoftYaHei',
      },
      splitNumber: 3,
      axisLine: {


        show: false
      },
      axisTick: {


        show: false
      },
      splitLine: {


        show: false
      }
    },
    yAxis: {


      data: data.axisdata,
      axisLine: {


        show: false
      },
      axisTick: {


        show: false
      },
      axisLabel: {


        color: 'rgba(255,255,255,0.4)',
        fontFamily: 'MicrosoftYaHei',
        fontSize: 12,
      },
    },
    series: [
      {


        type: 'custom',
        renderItem: renderItem,
        itemStyle: {


          opacity: 0.8
        },
        encode: {


          x: [1, 2],
          y: 0
        },
        data: data.serisedata
      }
    ]
  };
数据结构
for (let i = 0; i < 4; i++) {


    chartData.push({


      deviceId: "1234567" + i,
      deviceName: "设备2" + i,
      equipStartStopDataDtoList: [
        {

     state: "启动", startTime: "1649837599556", endTime: "1649837961027" },
        {

     state: "停机", startTime: "1649837961027", endTime: "1649837992142" },
        {

     state: "启动", startTime: "1649837992142", endTime: "1649838744110" }
      ]
    })
  };
	const axisdata: any[] = [];
      const serisedata: any[] = [];
      chartData.map((item: {

      deviceName: any; equipStartStopDataDtoList: any[]; }, index: any) => {


        axisdata.push(item.deviceName);
        item.equipStartStopDataDtoList.map((vv: any) => {


          serisedata.push({


            name: vv.state,
            value: [index, parseInt(vv.startTime), parseInt(vv.endTime)],
            itemStyle: {


              normal: {


                color: vv.state === "启动" ? '#485AB1' : '#4F5363',
              }
            }
          });
        });
      });
      const msg = {

     axisdata, serisedata };
js demo全部代码,仅供参考
<!DOCTYPE html>
<html lang="zh-CN">

<head>
  <meta charset="utf-8">
  <title>Profile - Apache ECharts Demo</title>
  <link rel="stylesheet" href="./style.css">
</head>

<body>
  <!-- 样式自行调整 -->
  <div id="chart-container" style="height: 160px;width: 100%;"></div>
  <script type="text/javascript" src="http://lib.sinaapp.com/js/jquery/2.2.4/jquery-2.2.4.min.js"></script>
  <script src="https://fastly.jsdelivr.net/npm/[email protected]/dist/echarts.min.js"></script>
  <script>
    var dom = document.getElementById('chart-container');
    var myChart = echarts.init(dom);
    var chartData = [];
    for (let i = 0; i < 4; i++) {


      chartData.push({


        deviceId: '1234567' + i,
        deviceName: '设备2' + i,
        equipStartStopDataDtoList: [
          {

     state: '启动', startTime: '1649837599556', endTime: '1649837961027' },
          {

     state: '停机', startTime: '1649837961027', endTime: '1649837992142' },
          {

     state: '启动', startTime: '1649837992142', endTime: '1649838744110' }
        ]
      });
    }
    var axisdata = [];
    var serisedata = [];
    chartData.map((item, index) => {


      axisdata.push(item.deviceName);
      item.equipStartStopDataDtoList.map((vv) => {


        serisedata.push({


          name: vv.state,
          value: [index, parseInt(vv.startTime), parseInt(vv.endTime)],
          itemStyle: {


            normal: {


              color: vv.state === '启动' ? '#485AB1' : '#4F5363'
            }
          }
        });
      });
    });

    function renderItem(params, api) {


      const categoryIndex = api.value(0);
      const start = api.coord([api.value(1), categoryIndex]);
      const end = api.coord([api.value(2), categoryIndex]);
      const height = api.size([0, 1])[1];
      const rectShape = echarts.graphic.clipRectByRect(
        {


          x: start[0],
          y: start[1] - height / 4,
          width: end[0] - start[0],
          height: height / 2
        },
        {


          x: params.coordSys.x,
          y: params.coordSys.y,
          width: params.coordSys.width,
          height: params.coordSys.height
        }
      );
      return (
        rectShape && {


          type: 'rect',
          transition: ['shape'],
          shape: rectShape,
          style: api.style()
        }
      );
    }
    var option = {


      backgroundColor: '#15192D ',
      tooltip: {


        backgroundColor: 'rgba(19,26,60,0.85)',
        borderColor: 'rgba(89,112,221,0.45)',
        // formatter: function (params) {


        //   return params.value[1] + ' -  ' + params.value[2] + '<br/>' + params.name;
        // },
        textStyle: {


          color: 'rgba(255,255,255,0.85)'
        }
      },
      title: {


        text: 'Profile',
        left: 'center',
        show: false
      },
      grid: {


        height: '80%',
        top: '5%',
        bottom: '5%',
        right: '0%',
        left: '5%'
      },
      xAxis: {


        type: 'time',
        axisLabel: {


          // formatter: function (val) {


          //   return val;
          // },
          color: 'rgba(255,255,255,0.4)',
          fontFamily: 'MicrosoftYaHei'
        },
        splitNumber: 3,
        axisLine: {


          show: false
        },
        axisTick: {


          show: false
        },
        splitLine: {


          show: false
        }
      },
      yAxis: {


        data: axisdata,
        axisLine: {


          show: false
        },
        axisTick: {


          show: false
        },
        axisLabel: {


          color: 'rgba(255,255,255,0.4)',
          fontFamily: 'MicrosoftYaHei',
          fontSize: 12
        }
      },
      series: [
        {


          type: 'custom',
          renderItem: renderItem,
          itemStyle: {


            opacity: 0.8
          },
          encode: {


            x: [1, 2],
            y: 0
          },
          data: serisedata
        }
      ]
    };

    myChart.setOption(option)

  </script>
</body>

</html>