Echart自定义属性3

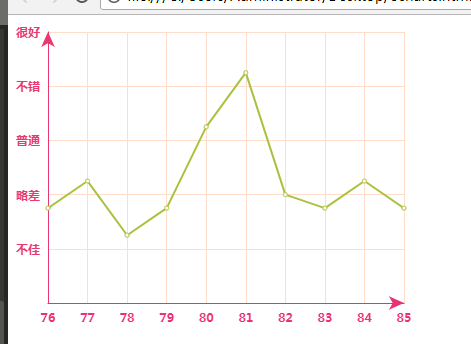
<!DOCTYPE html>
<html lang="en">
<head>
    <meta charset="UTF-8">
    <title>Document</title>
    <script src="https://apps.bdimg.com/libs/jquery/1.9.1/jquery.min.js"></script>
    <script type="text/javascript" src="http://echarts.baidu.com/gallery/vendors/echarts/echarts.min.js"></script>
</head>
<body>
    <div class="chart_content">
        <div id="container" style="width: 400px;height: 300px"></div>
    </div>

    <script type="text/javascript">
        var dom = document.getElementById("container");
        var myChart = echarts.init(dom);
        var app = {};
        option = null;
        option = {
            color: ['#aac13d'], //Y轴字的颜色
            //设置字体样式
            textStyle: {
                fontSize: 14,
                fontWeight: 700 
            },
            grid: {
                top: '3%',
                bottom:'0',
                left:'0',
                right:'3%',
                containLabel: true
            },
            xAxis: {
                axisTick: {
                    show: false   //去掉x轴刻度
                },
                splitLine: {  
                    show: true,
                    lineStyle: {  
                        // 使用深浅的间隔色  
                        color: ['#ffddc9']  
                    }  
                },  
                boundaryGap: false,
                data: [76,77,78,79,80,81,82,83,84,85],
                axisLine:{
                    symbol:['none','arrow'],//X轴箭头
                    lineStyle:{
                        color:'#ea3076',  //x轴颜色
                        width:1,//这里是为了突出显示加上的  
                    }
                },
            },
             yAxis: {
                axisTick : {show: false},//去掉刻度
                splitLine: {  
                    lineStyle: {  
                        // 使用深浅的间隔色  
                        color: ['#ffddc9']  
                    }  
                },  
                min:0,
                max:100,
                axisLabel:{   //修改y轴的数据
                        formatter: function (value) {
                            var texts = [];
                            if(value==0){}
                            else if(value<=20){
                                texts.push('不佳');
                            }
                            else if (value <=40) {
                                texts.push('略差');
                            }
                            else if (value <= 60) {
                                texts.push('普通');
                            }
                            else if(value <= 80){
                                texts.push('不错');
                            }
                            else{
                                texts.push('很好');
                            }
                            return texts;
                        }
                },
                //设置轴线的属性
                axisLine:{
                    symbol:['none','arrow'],//Y轴箭头
                    lineStyle:{
                        color:'#e9386f',  
                        width:1,//这里是为了突出显示加上的  
                    }
                },
            },
            series: [{
                data: [35,45,25,35,65,85,40,35,45,35],
                type: 'line',
                // areaStyle: {} //背景填充颜色
            }]
        };
        ;
        if (option && typeof option === "object") {
            myChart.setOption(option, true);
        }
    </script>
    
</body>
</html>

效果图:

猜你喜欢

转载自www.cnblogs.com/huanghuali/p/9173370.html
今日推荐