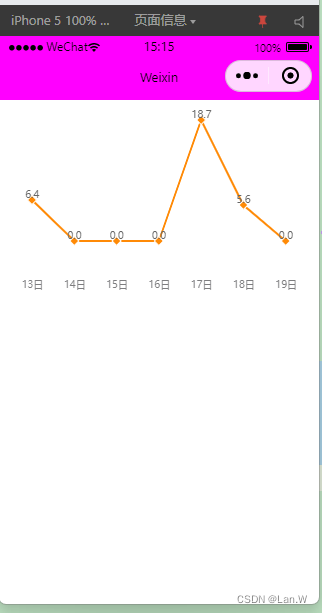
如下图:项目需求不显示包括x轴的6条灰色分割线。

分析:
看了一下源码已经写死了是5条分割线,加一条x轴刻度线。没给公开配置方法。

解决方案:
既然没有配置项目,可以转变思路,把这些线条配置成白色,那么也是等于没有线条。跟背景色一样。使用yAxis:{ gridColor:'#ffffff'}
yAxis: {
  min:-2.0,
  disableGrid: true,
  // y轴网格线的颜色
  gridColor:'#ffffff',}
效果:
案例效果源码:
//wxss
.chart {
  width: 700rpx;
  height: 600rpx;
}

//wxml
<view>
  <canvas canvas-id="linec" class="chart"> </canvas>
</view>

//js
const wxCharts = require("../../../utils/wxcharts.js")

let areaChart;
Page({
  LoadTu() {
    areaChart = new wxCharts({
      canvasId: 'linec', type: 'line',
      categories: this.data.chartDatas.day7,
      animation: true,
      yAxisSplit:2,
      series: [{
        name: '洗涤费',
        // 线条的颜色
        color: '#FF8A06',
        data: this.data.chartDatas.money7,
        format: function (val) {
          return val.toFixed(1) + '';
        }
      }],
      dataPointShape: true,
      xAxis: {
        fontColor: '#7D7D7F',
        // 不显示x轴 刻度点
        disableGrid: true,
      },
      yAxis: {
        min:-2.0,
        disableGrid: true,
        // y轴网格线的颜色
        gridColor:'#ffffff',
        // y轴文字颜色,display:true不显示
        fontColor: '#FF8A06',
        // 不显示y轴 刻度文字
        disabled: true,
        axisLine:{
          show:false
        }
      },
      // 非通用配置
      extra: {
        legendTextColor: '#c427b1',
        lineWidth: 10,
        // 线条形状:curve 圆滑
        // lineStyle: 'curve'
      },
      // dataPointShape:false,
      legend: false,
      width: 320, height: 200,
    });

    return this;
  },

  data: {
    menus: [],
    ordermsg: {},
    swiper_h: 0,
    chartDatas: {
      money7: [6.4, 0, 0, 0, 18.71, 5.6, 0],
      day7: ["13日", "14日", "15日", "16日", "17日", "18日", "19日"]
    }
  },
  onLoad: function (options) {
    this.LoadTu()
  }
});